
Figures & data
Figure 1. Characterization of UvSnf1 in U. virens. a, Relative expression levels of UvSnf1 during vegetative growth and invasive growth stages. Six mycelial plugs within the PS medium were shaken for 7 days at 28°C to extract RNA for determining the expression level of UvSnf1. The expression levels of UvSnf1 in the mycelia were normalized to 1. b, Subcellular localization of UvSnf1-GFP. Vegetative hyphae and spores of the transformants expressing UvSnf1-GFP were imaged using confocal microscope. Scale bar = 5 μm. BF, bright field. c, Deletion strategy of the UvSnf1 gene and the restriction enzyme sites for southern blot assay. The open reading frame of UvSnf1 was replaced by hygromycin (HYG) gene through homologous recombination. Scale bar = 500 bp. d, Southern blot assay of the WT and ΔUvsnf1 mutants. The XhoI was chose to digested genomic DNA of the WT and ΔUvsnf1 strains. The 1 Kb downstream sequence of UvSnf1 served as the probe for Southern blot assay. e, RT-PCR analyses of the WT, ΔUvsnf1-1, ΔUvsnf1-3 and ΔUvsnf1-C strains. f, Abundance of UvSnf1 transcript in mycelia of the WT, ΔUvsnf1-1, −3 and ΔUvsnf1-C strains. The relative expression levels were determined by Qrt-PCR with the tubulin gene as reference. The mean ± SD was calculated by the data of three independent replicates. P values were generated using the student’s t-test. Asterisks indicated remarkable differences compared with mycelia of the WT strain (*, ** and *** represent P < 0.05, P < 0.01 and P < 0.001).
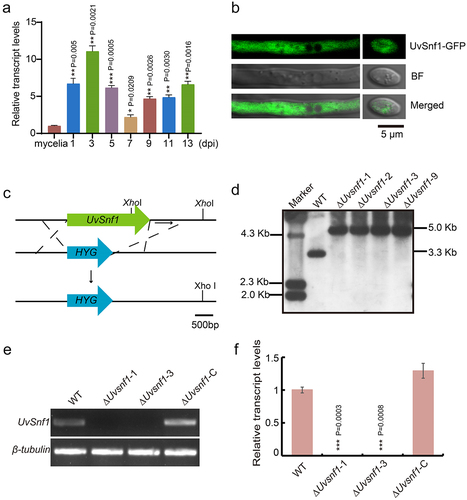
Figure 2. Deletion of UvSnf1 compromised growth, spore production and pathogenicity of U. virens. a, Colonies of the WT, ΔUvsnf1-1, −3 and ΔUvsnf1-C strains. The mycelial plugs of indicated strains were cultured on PSA plates for 14 days at 28°C to take pictures. b, Deletion of UvSnf1 reduced the colony diameters. The colony diameters of the WT, ΔUvsnf1-1, −3 and ΔUvsnf1-C strains were presented with mean ± SD. c and d, Deletion of UvSnf1 reduced spore production. Six mycelial plugs of the WT, ΔUvsnf1-1, −3 and ΔUvsnf1-C strains were cultured in the same volume of liquid PS medium for 7 days at 28°C. The pictures of conidia were taken under a bright field microscope. We conducted three technical replicates and two biological replicates for this experiment. Bar = 10 μm. e, Infection assay of WT, ΔUvsnf1-1, −3 and ΔUvsnf1-C strains. The mixture of hyphae and spores of the WT, deletion mutants and complemented strains were injection-inoculated with W×98(Wanxian 98, Oryza sativa subsp. indica) at booting stage. The photos were taken at 30 dpi. f, the false smut balls formed on rice panicles inoculated with the ΔUvsnf1 mutants were fewer than those of the WT and complemented strains. Three independent biological experiments were performed with at least 30 inoculated panicles of W×98cultivar each time. Significant differences were indicated by asterisks (** represent P < 0.01).
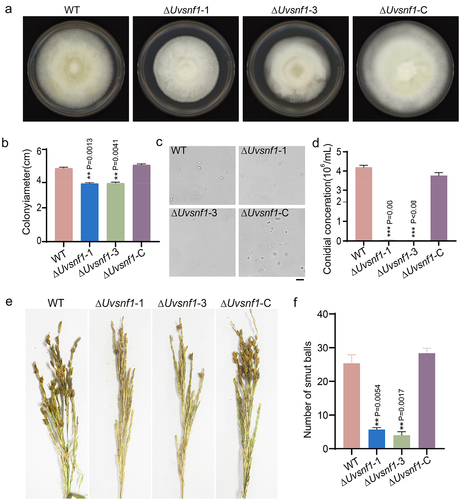
Figure 3. UvSnf1 participates in various carbon source utilization. a, Radial growth of the WT, ΔUvsnf1-1, −3 and ΔUvsnf1-C strains on the indicated medium for 14 days at 28°C. Basal PA (potato agar, potato 200 g and agar 20 g, add water to 1 L) medium was supplemented with various carbon source, including sucrose, glucose, tween 80, olive oil, triolein, maltose, raffinose, trehalose or glycerol at 1% (w/v). b, Inhibition rates of colony growth by various carbon source in the WT, ΔUvsnf1 mutants and complemented strains. The relative inhibition rate was calculated as follow: growth inhibition rate = (diameters of indicated strain on the PSA – diameters of strain on the PA medium with alternative carbon source)/diameters of the indicated strain on the PSA × 100%. The data were obtained from three repeats. Bars indicate the mean ± SD. *, ** and *** represent significant differences between the inhibition rates of mutants and WT at P < 0.05, P < 0.01 and P < 0.001 levels.
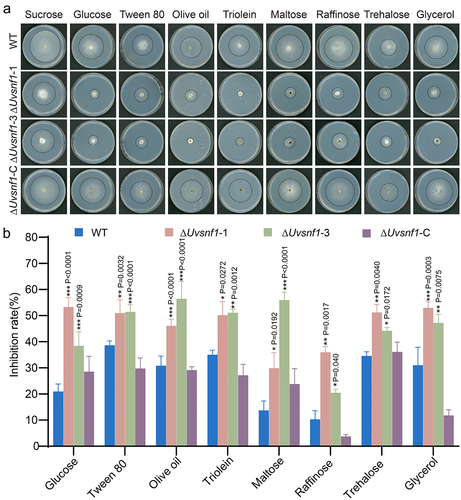
Figure 4. Deletion of UvSnf1 down-regulated the expression of cell wall-degrading enzymes genes under sucrose limited condition. a, the relative expression levels of CWDEs in the WT strain. The hyphae of WT strain were cultured by PA or PSA medium for 7 days at 28°C. b, the relative expression of CWDEs in the WT, ΔUvsnf1-1 and − 3 strains when sucrose is limited. The plugs of strains were inoculated in the indicated medium for 7 days at 28°C. PS medium is composed of 200 g potato and 20 g sucrose per L. P represents the medium containing potato 200 g per L. Quantitative experiments for each gene were performed with three technical replicates and two biological replicates. Error bars represent standard variations of three independent replicates experiments. Asterisks represent significant differences of the expression of CWDEs (*, ** and *** represent P < 0.05, P < 0.01 and P < 0.001).
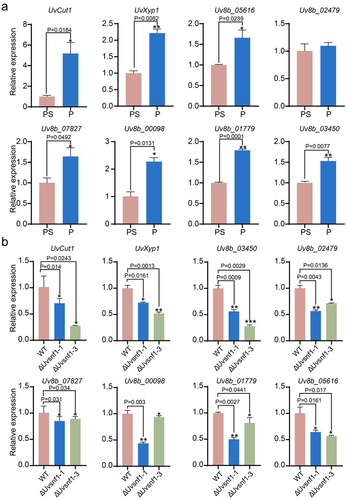
Figure 5. Deletion of UvCut1 and UvXyp1 reduced mycelial growth, spore production and virulence in U. virens. a, Colonies of the WT, ΔUvcut1, ΔUvxyp1 and complemented strains. The tested strains were cultured on the PSA plates for 14 days at 28°C. b, the colony diameters of the WT, ΔUvcut1, ΔUvxyp1 and complemented strains. The data were presented with mean ± SD. c, Spore production was reduced in the ΔUvcut1 and ΔUvxyp1 mutants. These strains were inoculated in PS medium at 28°C with 180 rpm for 7 days prior observation. Three independent repetitions were conducted with similar results obtained. d, Infection assays of the WT, ΔUvcut1, ΔUvxyp1 and complemented strains. e, the average number of false smut balls on the rice panicles inoculated with the mixture of hyphae and spores of corresponding strains. Three independent biological experiments were performed with at least 30 inoculated panicles of W×98cultivar each time. *, ** and *** represent significant differences between diameter, conidiation or smut balls number of WT and mutant strains at P < 0.05, P < 0.01 and P < 0.001 levels.
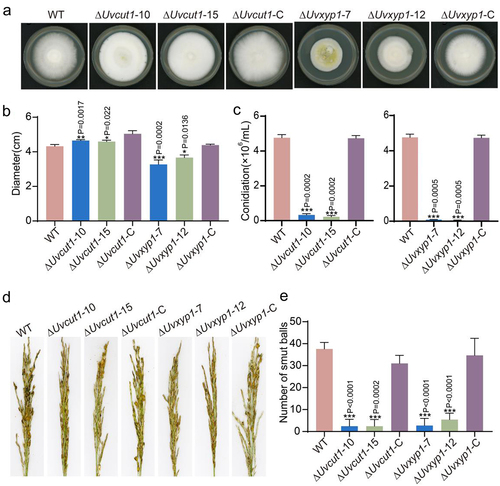
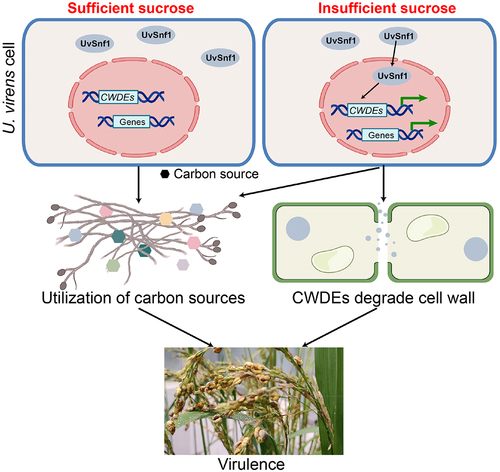
Figure 6. Proposed model for the role of UvSnf1 in U. virens. UvSnf1 is inactivated under sucrose sufficient condition. Under sucrose insufficient condition, UvSnf1 is activated and the transcriptional expression of downstream CWDE genes is derepressed. Subsequently, CWDEs degrade the cell wall and U. virens could utilize carbon source contributing to hyphae growth, spore production and infection in the host rice cells.
Supplemental Material
Download Zip (1.3 MB)Data Availability statement
All data generated or analyzed during the present study can be found within the manuscript and its supporting materials.