
Figures & data
Figure 1. C. innocuum induces nucleotide-binding oligomerization domain containing 2 (NOD2) and receptor-interacting protein 2 (RIP2) expression. HT-29 cells were infected with C. innocuum at (A) multiplicity of infection (MOI) of 100 for 0–4 h, and (B) MOI of 0–100 for 4 h. Expression levels of NOD2 and RIP2 were determined using western blotting. The protein expression levels of NOD2 and RIP2 were quantified by densitometric analysis and normalized to β-actin level, respectively, and indicated at the bottom of each lane.
Figure 2. C. innocuum recruits NOD2 to membrane rafts. HT-29 cells were infected with C. innocuum at MOI of 100 for 4 h. Cells were probed with (A and E) Hoechst 33,342 (blue), (B and F) anti-NOD2 (green), and (C and G) CTx-B (red), followed by performing confocal microscopy analysis. (E) arrowheads indicate the attached bacteria on the cell membrane. (D and H) yellow arrows indicate the area of confocal z-section analysis. Bars, 5 μm. White lines across the membrane shown in z-section indicate the distribution of fluorescence signals for C. innocuum (blue line), NOD2 (green line), and CTx-B (red line), which present as line intensity histograms in the right panels.
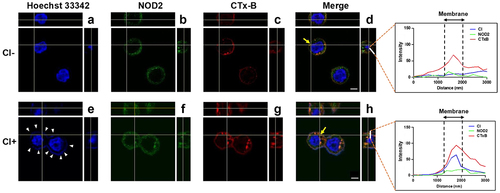
Figure 3. Live C. innocuum is essential for inducing cell death. HT-29 cells were treated with live C. innocuum, bacterial culture supernatant, heat-killed bacteria, and bacterial lysate for 24 h, followed by the (A) analysis of cell survival using 3-(4,5-dimethylthiazol-2-yl)-2,5-diphenyl tetrazolium bromide (MTT) assay, (B) stained with annexin V/propidium iodide, and analyzed using flow cytometry. (C) percentage of apoptotic cells was quantitated. *, P < 0.05.
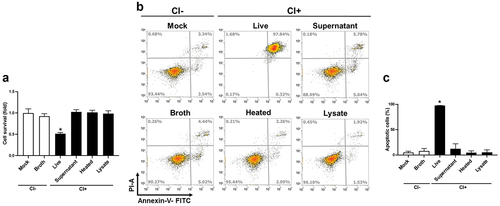
Figure 4. Inhibition of cholesterol synthesis reduces C. innocuum-induced NOD2 expression in lipid rafts. HT-29 cells were pretreated with simvastatin (100 μM) for 1 h prior to C. innocuum infection. Cells were probed with Hoechst 33,342 (blue), anti-NOD2 (green), and CTx-B (red), followed by confocal microscopy analysis. Bars, 5 μm.
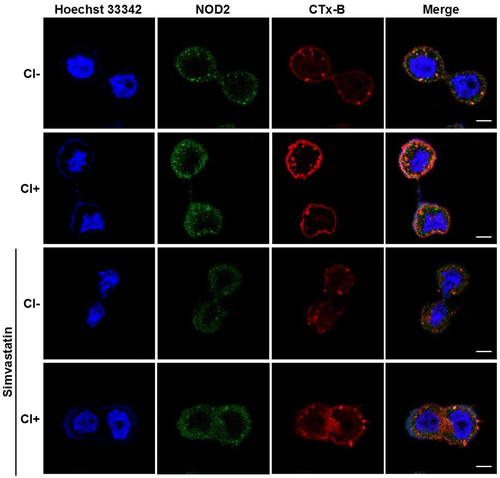
Figure 5. Simvastatin attenuates C. innocuum-induced apoptosis. (A) HT-29 cells were pretreated with simvastatin or pretreated with simvastatin then replenished with cholesterol (400 μg/mL). Cells were infected with C. innocuum for 24 h and stained with annexin V/propidium iodide, followed by flow cytometry analysis. (B) percentage of apoptotic cells was quantitated. (C) HT-29 cells were co-transfected with the nuclear factor (NF-κB) and pGL3 luciferase reporters and treated with simvastatin (100 μM) for 1 h, followed by C. innocuum infection for 24 h. NF-κB promoter activity was determined and normalized to pGL3 luciferase activity. (D) IL-8 production was analyzed by using ELISA. *, P < 0.05.
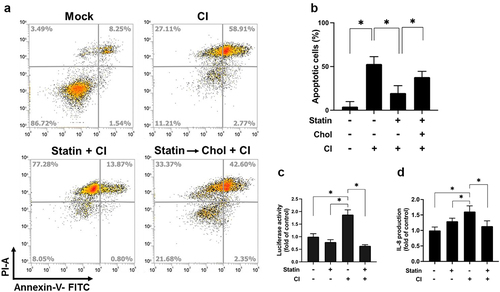
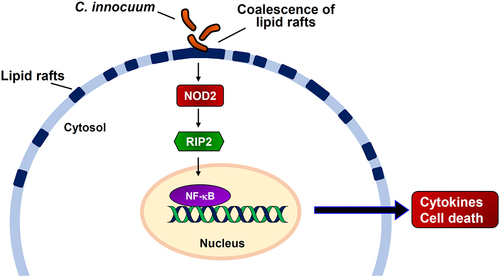
Figure 6. Hypothesized model illustrates C. innocuum-induced pathogenicity of intestinal epithelial cells. C. innocuum infection coalesces lipid rafts on the cell membrane, which then activates NOD2 pathway to promote NF-κB translocation in the nucleus, resulting in exacerbates cytotoxicity and inflammation of intestinal epithelial cells.
Data availability statement
The authors confirm that the data supporting the findings of this study are available within the article.