
Figures & data
Figure 1. Development of a murine model of iGAS infection and IAV – iGAS coinfection. a) Balb/C mice were intraperitoneally (i.p.) inoculated with a non-lethal dose of the GAS strain MGAS315 on day 0 and morbidity and mortality were monitored for 21 d (n = 16). b) separate groups of Balb/C mice were intranasally (i.n.) infected with a non-lethal dose of IAV (HK68) followed by a non-lethal intraperitoneal (i.p.) infection with MGAS315 on days 3, 5, 7, or 10 and morbidity and mortality were determined (n = 16 IAV only; n = 8 superinfected groups). In some experiments blood, lungs and spleens were collected 24 h after GAS infection for bacterial quantification and serum cytokine analysis. Additional controls included infecting mice with a non-lethal dose of IAV only and monitoring morbidity and mortality.
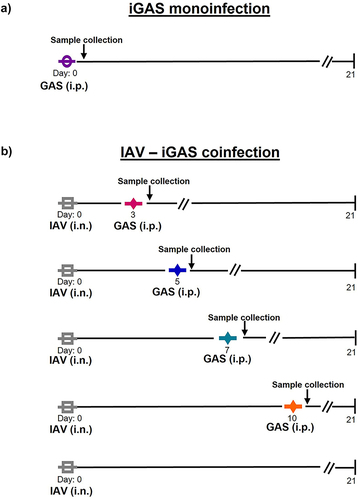
Figure 2. Mortality and morbidity are dependent on the timing of IAV-iGAS coinfection. Mice were inoculated with a non-lethal dose of IAV on day 0. On day 3 and 5 separate groups of mice were inoculated i.p. With a non-lethal dose of GAS. Mice were monitored for a) Survival and b) Weighted daily for 21 days. On day 7 and 10 separate groups of mice were inoculated i.p. With a non-lethal dose of GAS. Mice were monitored for c) Survival and d) Weighted daily for 21 d. The percent of the initial weight was calculated as an indicator of morbidity. For monoinfected animals (IAV or GAS only), groups of 8 mice were used, and two independent experiments were done resulting in groups of 16 mice. For superinfected mice groups of 4 mice were used and 2 individual experiments were completed resulting in 8 mice per group. A Kaplan–Meier survival analysis was used to compare the differences in mortality. The area under the curve analysis (AUC) was completed prior to a one-way ANOVA to compare the differences in morbidity.
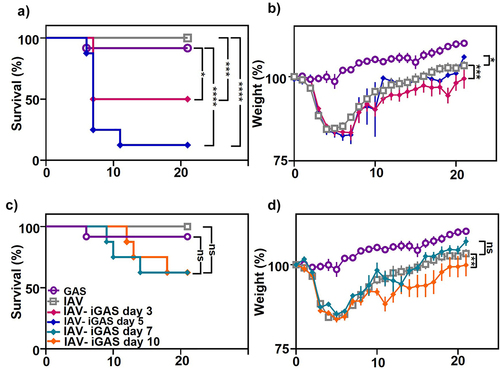
Figure 3. Viable GAS detected in the blood and tissues of iGAS and IAV- iGAS coinfected mice. Bacterial quantitation in iGAS infected and IAV-iGAS coinfected mice were determined in a) Blood b) Spleen c) Lungs 24 h after GAS infection. All experiments were performed in groups of 4 Balb/c mice. Statistical analysis was performed using the Mann–Whitney test among the indicated groups. Where no p value is shown the groups were not statistically different.
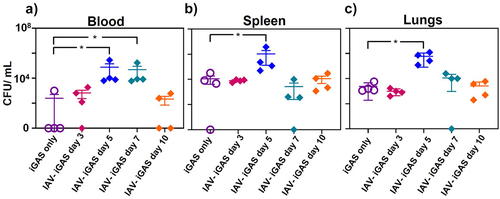
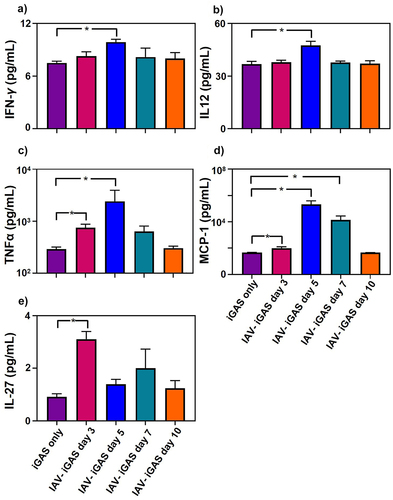
Figure 4. Inflammatory serum cytokine profiles of iGAS and IAV-iGAS coinfected mice. Protein concentrations of a) IFN-γ b) IL-12, c) TNF-α, d) MCP-1, and e) IL-27 were determined in the serum of 4 individual mice per group 24 h after iGAS infection or 24 h after IAV- iGAS infection from mice infected with iGAS 3, 5, 7, or 10 d after IAV. Serum cytokine concentrations were determined by using flow cytometry. Statistical analysis was performed between single and coinfected mice using a one-way ANOVA with Tukey’s multiple comparisons test. Where no p value is shown the groups were not statistically different.
Supplemental Material
Download Zip (249.8 KB)Data availability statement
Raw data were generated at the University of South Dakota. Derived data supporting the findings of this study are available from the corresponding author ALH on request.