
Figures & data
Table 1. Characteristics of patients with chronic hepatitis B in the indeterminate phase.
Figure 1. Predictor selection using LASSO regression analysis. (a) three predictors were selected by deriving the optimal λ. (b) the optimal penalty coefficient λ of LASSO regression was determined by 10-fold cross-validation and minimum criterion.
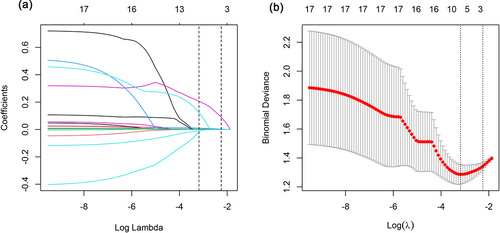
Figure 2. A nomogram for the prediction of significant liver inflammation in patients with chronic hepatitis B in the indeterminate phase (a). Draw a vertical line from the corresponding axis of each variable to the point axis. Calculate the points of all risk factors to determine the probability of significant inflammation. (b) a dynamic nomogram is used as an example.
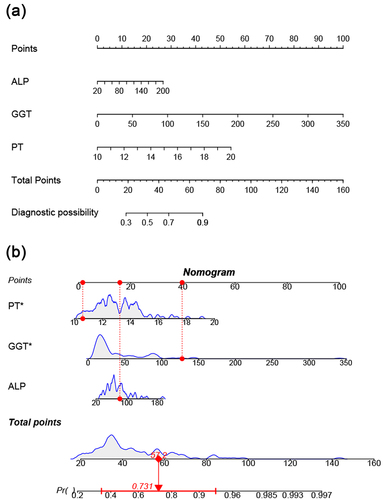
Figure 3. Calibration curves of the model for predicting significant liver inflammation in the training set (a) and validation set (b). The x-axis and y-axis represent the predicted and actual probability of significant liver inflammation, respectively.
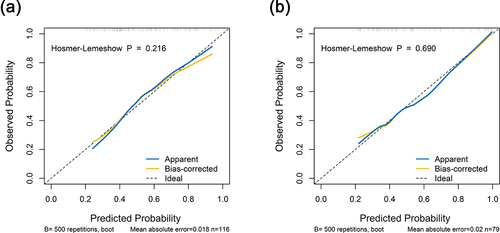
Figure 4. Decision curve analysis for the prediction of significant liver inflammation in the training set (a) and validation set (b). The x-axis is the threshold probability, the y-axis is the net benefit.
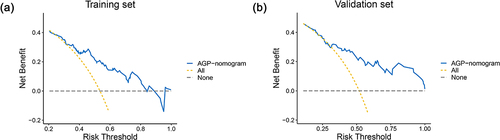
Table 2. Diagnostic performances of AGP-nomogram and ALT in the training set and validation set.
Supplemental Material
Download MS Word (482 KB)Data availability statement
The authors confirm that the data supporting the findings of this study are available within the article and its supplementary materials.