
Figures & data
Figure 1. Photographs of housing systems and eggs, tadpoles and adults of H. boettgeri. Tecniplast (1a), standard (1b), and static (1c) systems, female (black arrow; 1d, e) and male (filled white arrow pointing to post-axillary subdermal gland and unfilled white arrow pointing to obiculated tympanum; 1d, e) adult individuals, nursery tank of the Tecniplast system (1f), eggs inside the nursery tank (1g), 4-d-old tadpoles feeding on powdered food (1h), and 12-d-old tadpoles feeding on brine shrimp (1i). Black bars represent 1 cm scale.
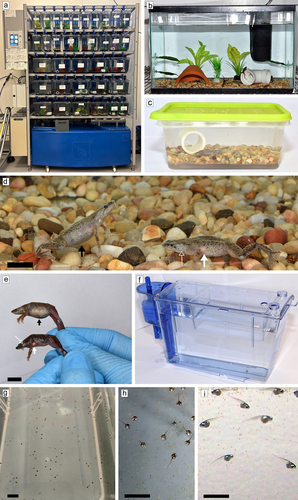
Figure 2. Survival probability curves of JEL423 and CLFT073 Bd genotypes at high (HD) or low (LD) dose. p-value is from log-rank test.
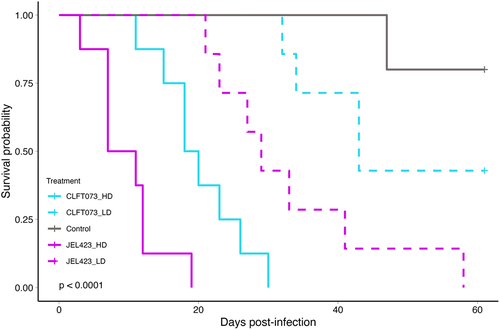
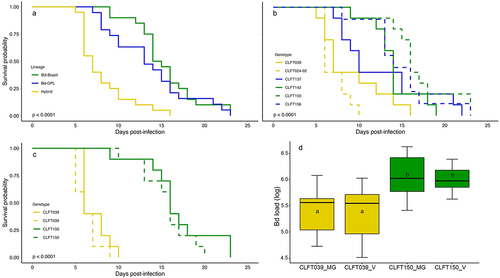
Figure 3. Survival curves and Bd load boxplot from the model generalizability and validation experiments. Survival curves for H. boettgeri exposed to six Bd genotypes from the model generalizability experiment, built at (a) lineage or (b) genotype level. (c) survival curves and (d) Bd load (log transformed at time of death) boxplots for H. boettgeri exposed to CLFT039 and CLFT150 genotypes from model generalizability (solid line/MG boxes) and validation experiments (dotted line/V boxes). Yellow, blue and green lines/boxes indicate that the Bd genotype belongs to hybrids, Bd-GPL and Bd-Brazil lineages, respectively. p-values are from log-rank test. Letters 'a' and 'b' inside the boxplots represent statistically significant differences from post-hoc multiple comparisons of means test among Bd genotype/experiments.
Supplemental Material
Download MS Word (57.4 KB)Data availability statement
The data and full codes for all statistical tests are available at https://doi.org/10.5281/zenodo.8434900.