
Figures & data
Table 1. Background information on the five Aeromonas isolates.
Figure 1. Population distribution of the five Aeromonas isolates with 207 Aeromonas genomes. The phylogenetic tree was generated using the maximum-likelihood method and accompanied by bootstrap analysis, which assigned a degree of support (percentage) to each associated taxa cluster. The bootstrap values were represented using a bootstrap bar with different-sized circles for each branch. The tree scale bar corresponded to the scale of sequence divergence. The species in NCBI of each branch were denoted with different background colours. The newly sequenced Aeromonas isolates were marked with red stars, while blue dots were used to indicate other isolates carrying chromosomal borne elements identified in this study.
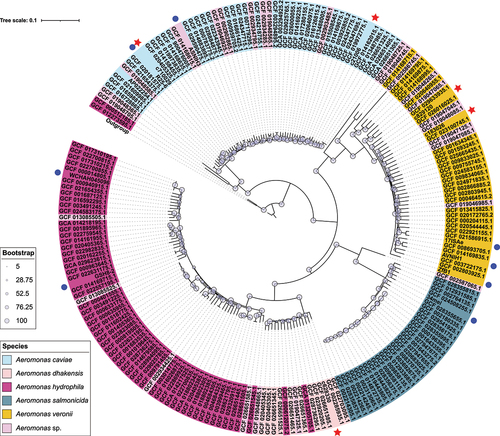
Table 2. Major features of the 19 chromosome-borne accessory genetic elements.
Figure 2. Heatmap of the prevalence of drug resistance genes. Each row represents a unique element, while each column represents a resistance gene. Resistance genes are categorized by dashed lines for clarity. The heatmap utilizes a colour scheme in which red squares indicate gene presence and blue squares indicate gene absence.
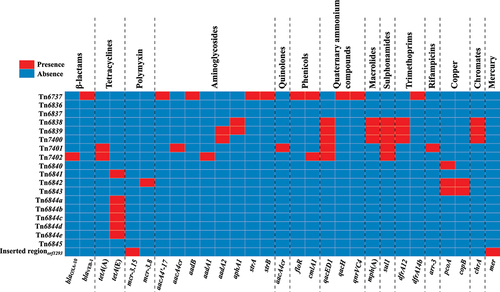
Figure 3. Comparison of Tn6836 and six related IMEs. Genes were visually depicted as arrows, while mobile genetic elements and other features were distinguished by their assigned colour based on their functional classification. Regions of homology, defined by nucleotide identity greater than 95%, were highlighted with a shaded background. Pseudogenes were denoted by a single quotation mark preceding their name.
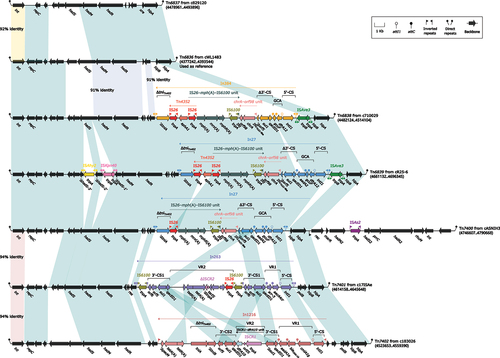
Figure 4. Comparison of Tn6844a and five related IMEs. Genes were illustrated as arrows, while mobile genetic elements and other features were designated with distinct colours corresponding to their functional classification. Regions of homology, which were defined by nucleotide identity greater than 95%, were highlighted with a shaded background. Pseudogenes were indicated by a single quotation mark preceding their name.
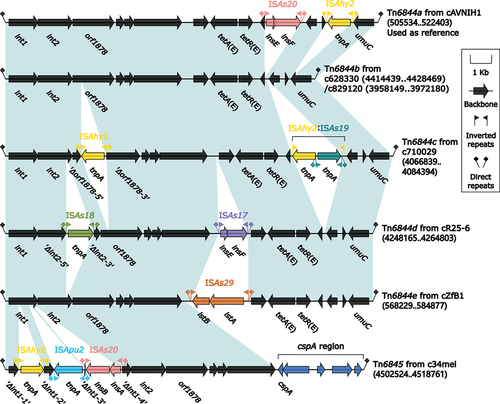
Figure 5. Comparison of Tn6840 and three related IMEs. The figure utilizes arrows to represent genes, while mobile genetic elements and other features are distinguished with distinct colours based on their functional classification. Regions of homology, which are defined by nucleotide identity greater than 95%, are highlighted with a shaded background. Pseudogenes are identified by a single quotation mark preceding their name.
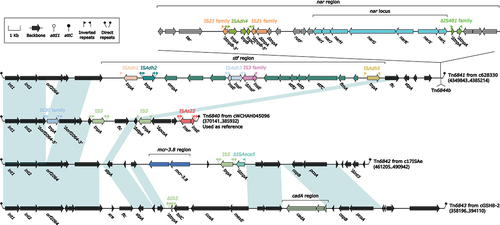
Figure 6. Organization of Tn6737. The figure utilizes arrows to represent genes, while transposons, integrons, and other features are distinguished with distinct colours based on their functional classification. Regions of homology, which are defined by nucleotide identity greater than 95%, are highlighted with a shaded background. Pseudogenes are identified by a single quotation mark preceding their name.
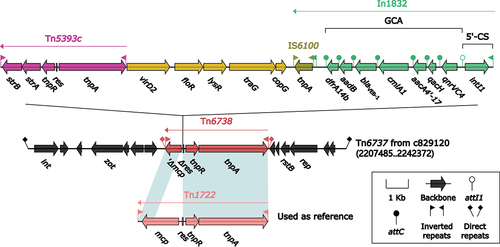
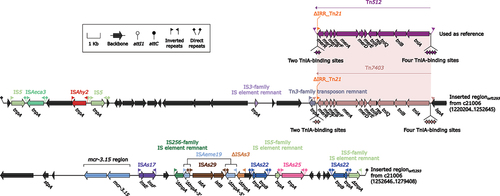
Figure 7. Organization of Inserted regionorf1293. Arrows are utilized to represent genes. Transposons and other features are distinguished with distinct colours based on their functional classification. Pseudogenes are identified by a single quotation mark preceding their name.
Supplemental Material
Download Zip (65.5 KB)Data Availability statement
The data presented in this study are available on request from the corresponding author. The sequences analyzed in this study can be found in the public GenBank database. The accession numbers were provided in this article.