Figures & data
Table 1. Alpha diversity indexes and their corresponding equations.
Figure 1. Overview of study selection process. PRISMA flow chart showing the article screening process from three databases: PubMed, Google Scholar, Web of Science.
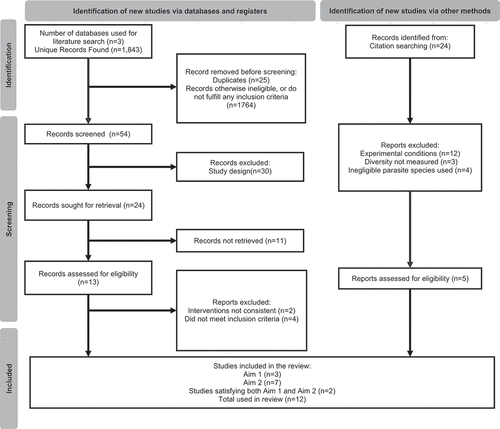
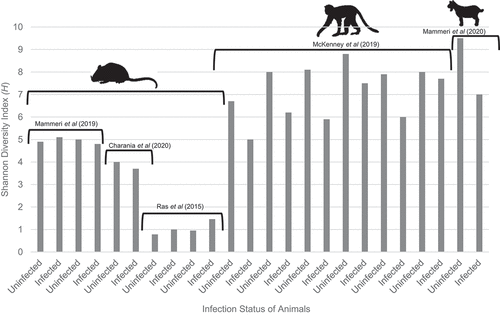
Table 2. Compiled Shannon index scores (H) from studies further described in .
Table 3. Studies included in this review.
Figure 2. Shannon index scores (H) from studies described in . Shannon Index (H) values obtained from studies listed in . Order of the bars follows the order of (descending) from left to right. Where specific Shannon Diversity Indexes could not be found within the study, the value was estimated from graphs provided within studies or the supplementary material. Mice studies indicated by mouse image, primate study highlighted with primate image, goat subjects indicated using a goat image. Images obtained from BioRender, then edited to remove colour.