
Figures & data
Figure 1. ArcA positively regulates the expression of luxT by directly interacting with its promoter. (a) EMSA of ArcA-P protein and luxT promoter DNA. The luxT promoter DNA (50 ng) and ArcA-P protein (0 to 1.25 µM) were used in each reaction; 4.5s RNA was used as a negative control. (b) qRT-PCR elucidated luxT expression level in the WT, ΔarcA, and ΔarcA::ParcA strains in LB broth. Data were depicted as mean ± SD (n = 3); unpaired Student’s t-test was applied to assess p-values (*p < 0.05; **p < 0.01; ***p < 0.001; NS, not significant, p > 0.05).
Figure 2. luxT expression is induced by a low oxygen signal in the small intestine via ArcA. (a) qRT-PCR expression level of luxT in the WT and ΔarcA mutant strains in LB broth during anaerobic or aerobic conditions. (b) luxT expression in LB broth and in the small intestine. (c) qRT-PCR expression level of luxT in the WT, ΔarcA, and ΔarcA::ParcA strains in the small intestine. Data were depicted as mean ± SD (n = 3); unpaired Student’s t-test was applied to assess p-values (*p < 0.05; **p < 0.01; ***p < 0.001; NS, not significant, p > 0.05).
Figure 3. LuxT promotes V. cholerae colonization in infant mouse intestine. (a) the capability of the WT, ΔluxT, and ΔluxT::PluxT strains to colonize the intestines of infant mice was assessed via a mouse intestinal colonization assay. Bacterial counts in the mouse intestine (CFU per milliliter) were determined 22–24 h after intragastric inoculation with V. cholerae E12382 strain. (b) competition assay comparing the colonizing ability of WT, ΔluxT, and ΔluxT::PluxT in infant mouse intestine. Each symbol represents the CI in an individual mouse, horizontal bars indicate the median. Unpaired Student’s t-test was applied to assess p-values (*p < 0.05; **p < 0.01; ***p < 0.001; NS, not significant, p > 0.05).
Figure 4. LuxT enhances V. cholerae virulence gene expression by directly repressing hapR expression. (a) qRT-PCR elucidated virulence gene expression levels in the WT, ΔluxT, and ΔluxT::PluxT strains in LB broth. (b) qRT-PCR expression level of hapR in the WT, ΔluxT, and ΔluxT::PluxT strains in LB broth. Data were represented as the mean ± SD (n = 3); unpaired Student’s t-test was applied to assess p-values (*p < 0.05; **p < 0.01; ***p < 0.001; NS, not significant, p > 0.05). (c) EMSA of LuxT protein and hapR promoter DNA. The hapR promoter DNA (50 ng) and LuxT protein (0 to 2 µM) were used in each reaction; 4.5s RNA was used as a negative control. (d) LuxT binds to a motif in the hapR promoter region. Electropherograms indicated the hapR promoter region’s protection pattern after DNase I digestion and incubation with and without LuxT protein (2 μM). The protected region revealed a substantially decreased peak intensities pattern (red) than the control (blue). The bottom of the figure depicts elucidated LuxT-binding motif in a box.
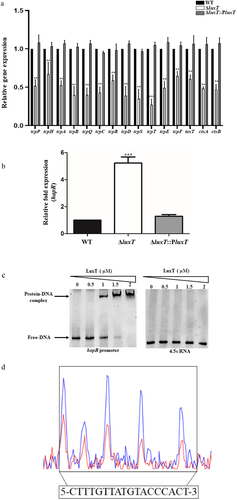
Figure 5. LuxT inhibits hapR transcription at low cell densities. qRT-PCR assessed hapR expression level in the WT, ΔluxT, and ΔluxT::PluxT strains at the cell densities indicated. Data were represented as the mean ± SD (n = 3); unpaired Student’s t-test was applied to assess p-values (*p < 0.05; **p < 0.01; ***p < 0.001; NS, not significant, p > 0.05).
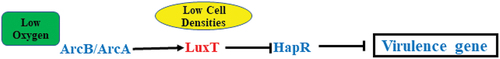
Figure 6. Diagram depicting the LuxT-mediated virulence regulatory networks in V. cholerae strain E12382. The expression of luxT in V. cholerae was induced in the small intestine in response to the low oxygen conditions via ArcA. Meanwhile, LuxT directly inhibited hapR translation at low cell density. As a consequence, the expression of virulence gene was derepressed and timely produced.
Supplemental Material
Download MS Word (178.4 KB)Data availability statement
The authors confirm that the data supporting the findings of this study are available in the article and its supplementary materials.