
Figures & data
Table 1. Primers for amplification and sequence analysis of HIV-1 integrase (IN) region.
Figure 1. Flow chart of our study.(INSTI integrase strand transfer inhibitor;ART antiretroviral therapy;DR drug resistance).
Table 2. Baseline demographic and viral characteristics.
Table 3. INSTI-associated mutation in ART-treated and naive patients.
Table 4. Analysis of INSTI drug resistance mutations.
Table 5. Prevalence of drug-specific INSTI mutation in ART-treated and naive patients.
Figure 2. A phylogenetic analysis of the in gene.
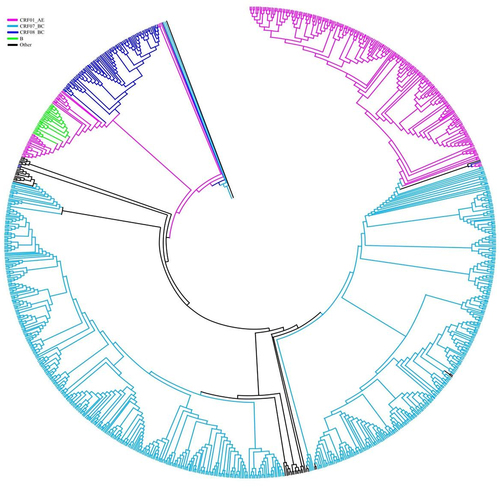
Table 6. Distribution and prevalence of INSTI DR among HIV-1 subtype.
Data Availability statement
The data in this study are available from the first author (HZ.Z) on reasonable request.