
Figures & data
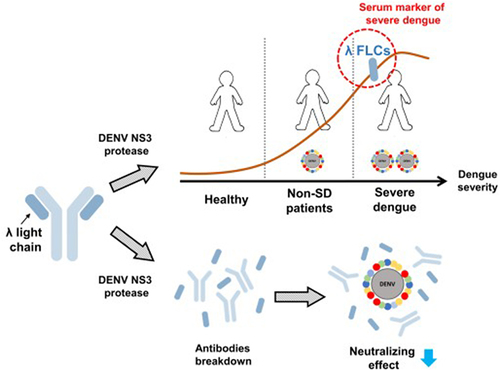
Figure 1. Positive correlation of serum λ and κ FLCs in dengue patients.
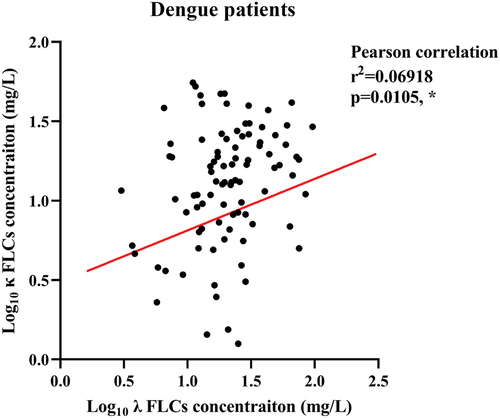
Figure 2. Higher serum λ free light chain expression in dengue patients with varying severity.
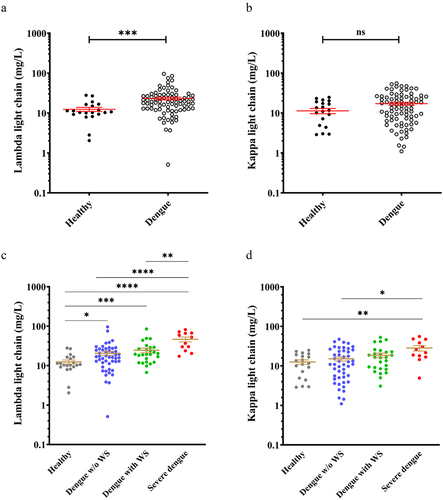
Figure 3. Lambda (λ) free light chain as a potential serum marker of dengue disease and severe dengue classification.
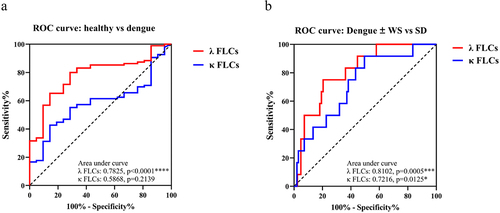
Table 1. Area under ROC curve of serum free light chains to discriminate dengue patients.
Figure 4. Lambda (λ) free light chain appears upon co-incubation of IgG and DENV protease.
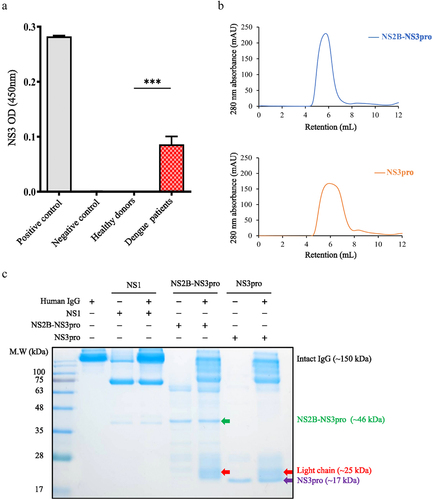
Table 2. Protein composition revealing light chain product after NS2B-NS3pro treatment.
Table 3. Protein composition revealing light chain product after NS3pro treatment.
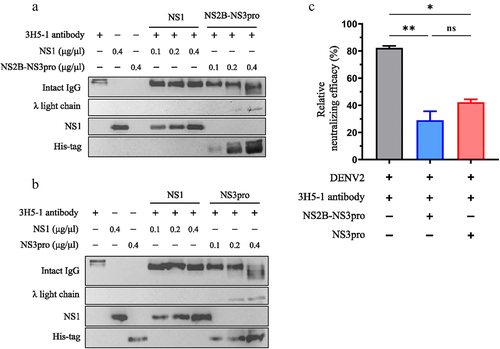
Figure 5. Lambda (λ) free light chain increases in a trend of dose-dependent manner after DENV protease cleaves human IgG.
Figure 6. DENV protease cleaves DENV2-neutralizing antibodies resulting in λ free light chain increase and neutralizing efficacy reduction.
Supplemental Material
Download Zip (1.3 MB)Data Availability statement
The supporting data for this study can be obtained from the corresponding author upon reasonable request.