
Figures & data
Figure 1. Purification and characterisation of C-OPSBa and CTBTri-OPSBa. a) schematic diagram of the process of CTBTri-OPSBa nanovaccine expression in YeO9_52212 cell and vaccination in mice, and the subsequent pathogen challenge in vaccinated mice. b) the plasmid map of pPglL-CTBTri. c) YeO9_52212 was transformed with expression plasmids and then induced with IPTG (0.1 mM), and Coomassie blue staining and western blotting using a 6 × His tag antibody were performed to analyse the glycosylated expression of CTB and CTBTri in YeO9_52212. d) after purification, the C-OPSBa and CTBTri-OPSBa were analysed by Coomassie blue staining, western blotting using anti 6 × His Tag, anti-Y. enterocolitica O:9 (anti Ye), and anti-B. abortus (anti Ba) antibodies. e) TEM image and F) DLS analysis of the purified NP-OPSBa. G) DLS analysis of NP-OPSBa stored at room temperature at different time points.
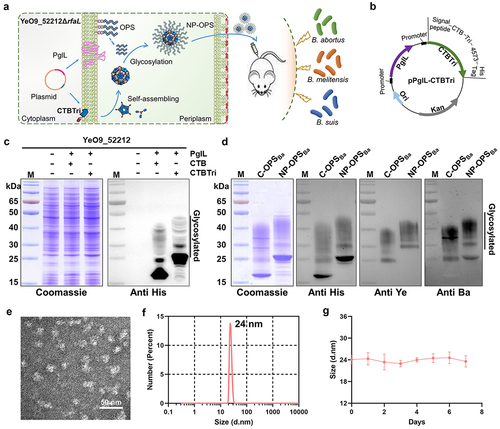
Figure 2. Safety evaluation of nanovaccine. a) experimental schedule for the safety evaluation. b) the temperature and weight of normal mice and immunised mice were determined every 3 days after immunisation until the 15th day. c) histological analysis of heart, liver, kidney, lung, and spleen in mice.
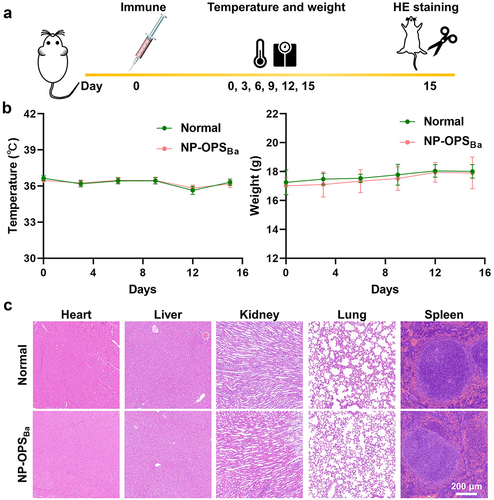
Figure 3. Strong antibody response and protection against different Brucella strains induced by NP-OPSBa in mice. a) schematic diagram of titre measurements and the lethal challenge experiment. b) serum IgG antibody titres. c) IgG1 and IgG2a antibody titres against YeO9_52212 LPS after third immunisation. Data are Lg10-transformed and presented as means ± SD and analysed by one-way ANOVA with Dunn’s multiple comparison test: ****p < 0.0001 and **p < 0.01. d) OPS-specific IgG isotype antibody titre IgG1/IgG2a ratios. D) Fourteen days after the third immunisation, the mice were challenged with a lethal dose of E) B. abortus, F) B. melitenesis, or G) B. suis and their survival was monitored for 14 days.
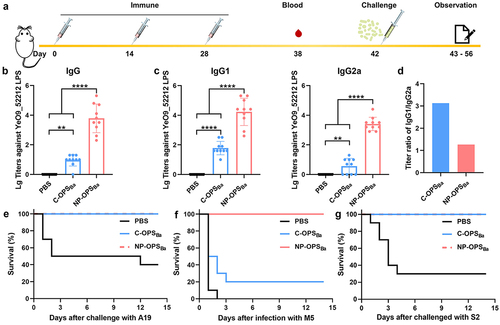
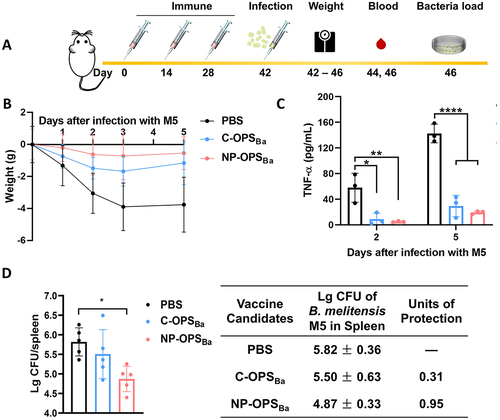
Figure 4. Evaluation of immunised mice following non-lethal doses of Brucella infection. Mice were immunised and infected with a non-lethal dose of B. melitensis following schematic diagram A), then we determined the B) weight (n = 5), C) serum TNF-α (n = 3) of mice, D) bacterial load (n = 5) in the spleen of mice 5 days after infection. Data are presented as means ± SD and analysed by one-way ANOVA with Dunn’s multiple comparison test: ****p < 0.0001, ***p < 0.001, **p < 0.01, and *p < 0.05.
Supplemental Material
Download MS Word (501.5 KB)Data Availability statement
The authors confirm that the data supporting the findings of this study are available within the article and its supplementary materials.