
Figures & data
Table 1. Primer sequences of the genes for qRT-PCR.
Figure 1. Histopathological changes of chicken spleen tissues (200x). (n = 3). Experimental groups including (A) Control group (B) MS-infection 3 dpi group (C) MS-infection 6 dpi group (D) MS-infection 12 dpi group. Black arrows represent spleen tissue losing its compact arrangement with increased infiltration of inflammatory cells. Green arrows represent lymphocyte infiltration. Red arrows represent necrotic fragments of lymphocytes. Yellow arrows represent bleeding.
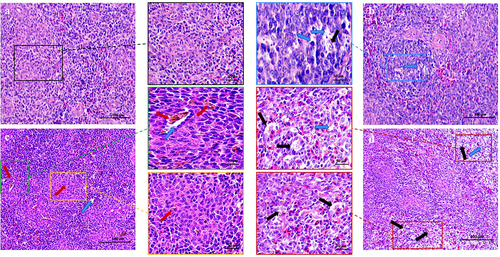
Figure 2. Shows the effect of MS-infection on ultrastructural changes in the spleen of chickens (×6,000). (A) Control group, the normal mitochondrial structure (black box) (B) MS-infection 3 dpi group, with mitochondrial swelling, cristae disorders, and vesicles (blue box); (C) MS-infection 6 dpi group with extensive formation of vesicles (yellow box); (D) MS-infection 12 dpi group, presence of apoptotic cells with nuclear lysis, cell membrane rupture, and cell necrosis (red box). (n = 3)
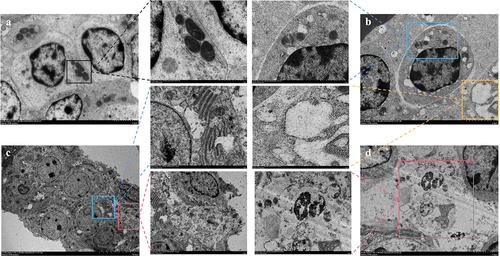
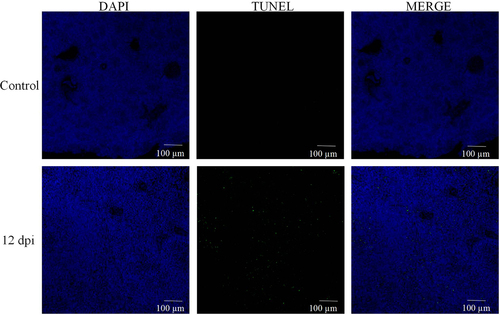
Figure 3. MS induces apoptosis in the spleen tissue of carp. (A) TUNEL staining of spleen tissue; (B-G) apoptosis-related gene iNOS, Bcl-2, Bax, caspase3, caspase8, caspase9, and p-53 mRNA expression levels; n = 3 for each group; *p< 0.05, ***p< 0.001 versus control.
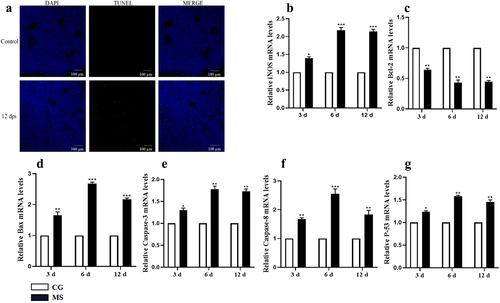
Figure 4. Shows the effect of MS-infection on oxidative stress-related parameters measured on 3, 6 and 12 day in chicken spleen. The assessed parameters are: (A) GSH-PX activity, (B) CAT activity, (C) T-SOD activity, (D) MDA content, (E) NO content and (F) iNOS content. All the bar graphs show mean results ± SD (n = 3). Experimental groups are represented as control group and MS-infection group. Different small letters indicate statistical significance (p < 0.05) between the two experimental groups at the same time point.
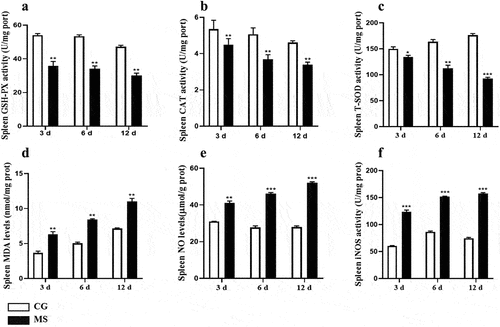
Figure 5. The activation of the NF-κB pathway. (A) western bolt strip of NF-κB related proteins TLR4, IκBα, p-IκBα, p65, p-p65,TLR4 and β-actin (n = 3); (B-D) the ratio of relative protein levels of TLR4/β-actin, p-IκBα/IκBα, p-p65/p65. (E-H) NF-κB, TLR4, IκBα, p65 mRNA expression levels. Different small letters indicate statistical significance (p < 0.05) between the two experimental groups at the same time point.
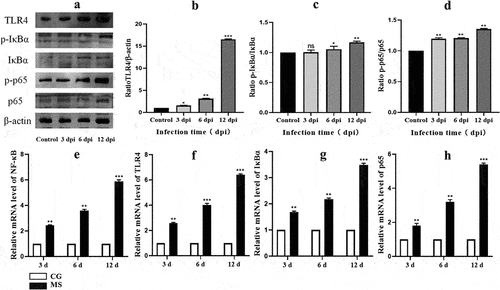
Figure 6. Shows the effect of MS-infection on cytokine mRNA. (A) western bolt strip of TNF-α、IL-6、IL-1 βand β-actin (n = 3). (B-D) the ratio of relative protein levels to β-actin. (E-G) TNF-α、IL-6 and IL-1 βmRNA expression level. Different small letters indicate statistical significance (p < 0.05) between the two experimental groups at the same time point.
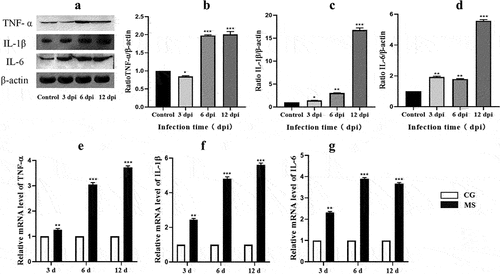
Figure 7. The activation of the MAPK pathway. (A) hosphorylated protein expressions of JNK, ERK in chicken spleens. (n=3). (B-C) the ratio of relative protein levels of p-JNK/JNK, p-ERK/ERK. (D-E) JNK、ERK mRNA expression level. Different small letters indicate statistical significance (p < 0.05) between the two experimental groups at the same time point.
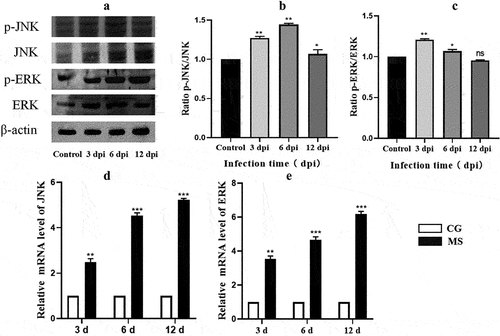
Figure 3, A.jpg
Download JPEG Image (153.7 KB)
Data Availability Statement
All datasets generated for this study are included in the article/Supplementary Material.