
Figures & data
Table 1. Bacterial strains and plasmids used in this study.
Table 2. Gene-specific primers used in this study.
Figure 1. Sequence alignment between CDT holotoxin from A. actinomycetemcomitans, H. ducreyi, G. parasuis, S. dysenteriae, E. coli, C. jejuni, and H. hepaticus. the alignment was generated using ClustalW2 algorithm and presented using ESPript 3.0 (http://espript.Ibcp.fr/ESPript/cgibin/ESPript.Cgi). Identical residues are indicated by the dark red background and conserved residues are in red text.
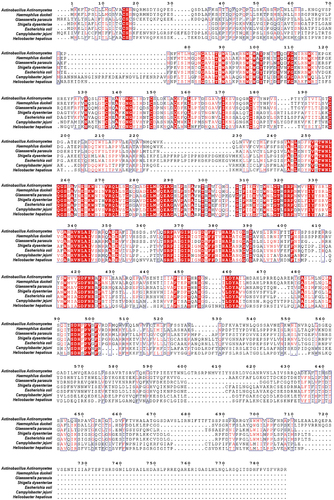
Figure 2. G. parasuis CdtABC induces DNA double-strand breaks (DSB), cell death and inhibits cell viability in NPTr cells. NPTr cells were treated with 500 ng/mL G. parasuis CdtA, CdtB, CdtC, CdtABC, 100 MOI of live G. parasuis WT strain (G. parasuis), and 100 MOI of live G. parasuis mutant strain (G. parasuis mut) for 36 h. (A) DNA damage marker γH2AX was measured using immunofluorescence microscopy. Scale bar 100 μm. (B, C) after treated with G. parasuis CdtA, CdtB, CdtC, CdtABC, live G. parasuis WT strain, and live G. parasuis mutant strain, cell viability and LDH release were measured using CCK-8 and LDH release assay (n = 3).
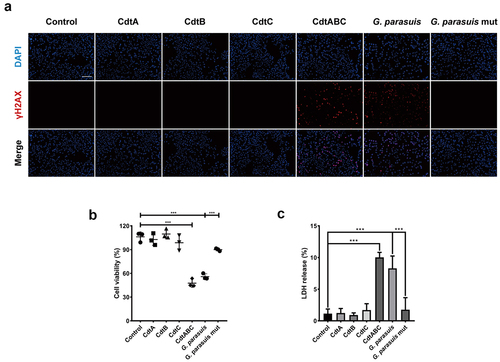
Figure 3. G. parasuis CdtABC induces apoptosis in NPTr cells via p53-dependent pathway. NPTr cells were treated with different concentrations (0, 5, 50, or 500 ng/mL) of G. parasuis CdtABC for 36 h. (a) the percentage of apoptotic cells in NPTr cells was measured using flow cytometry. The doxorubicin was used as a positive control, while DMSO and BSA were used as negative controls. (b) activity of apoptosis factor caspase-3 was measured in NPTr cells. (c) the mRNA levels of p53, BAX, and Bcl-2 in NPTr cells were analyzed using qRT-PCR after treatment with CdtABC. (d, e) expression of p-p53, p53, BAX, and Bcl-2 in NPTr cells was measured after CdtABC stimulation. To reveal that NPTr apoptosis was induced by G. parasuis CdtABC via a p53-dependent pathway, NPTr cells were exposed to G. parasuis CdtABC (500 ng/mL) with or without pifithrin-α (40 μM), a specific p53 blocker. (f) the percentage of apoptotic cells in NPTr cells was measured using flow cytometry. (g) activity of caspase-3 was measured. (H) expression of p53, BAX and Bcl-2 in NPTr cells was examined after CdtABC stimulation. Band intensity ratios were calculated from Western blot and values give relative to control cells. The statistical significance of the indicated P values was determined as: *P < 0.05, **P < 0.01, ***P < 0.001. All data shown are representative of at least three independent experiments.
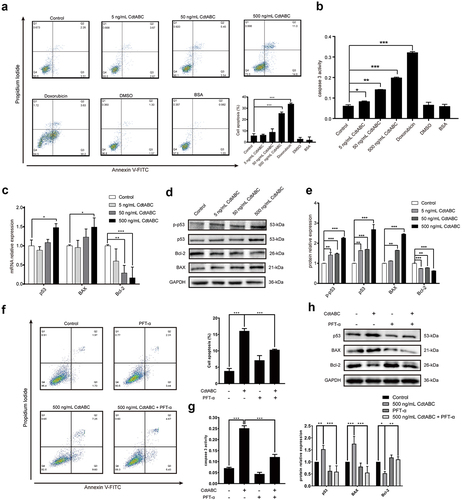
Figure 4. VRAC blockers inhibit G. parasuis CdtABC-induced apoptosis in NPTr cells. NPTr cells were pre-treated with 30 μM PPQ-102 or 10 μM NS3728 for 2 h and subsequently exposed to 500 ng/mL CdtABC for another 36 h. (a) the percentage of apoptotic cells in NPTr was measured using flow cytometry. (b) after CdtABC treatment, the activity of the apoptosis factor caspase-3 was measured. (c) the expression of p-p53, p53, and BAX protein relative to GAPDH in NPTr cells was analyzed using Western blot. Band intensity ratios were calculated from Western blot, and values are given relative to control cells. The statistical significance of the indicated P values was determined as: *P < 0.05, **P < 0.01, ***P < 0.001. All data shown are representative of at least three independent experiments.
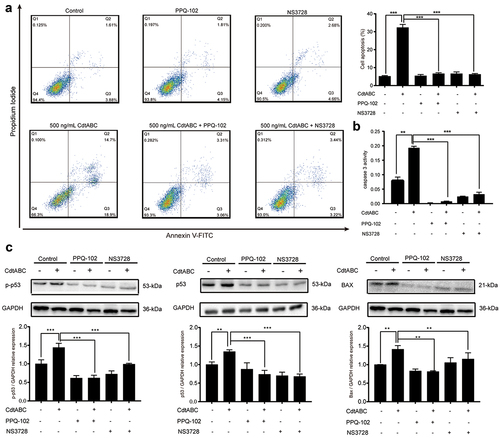
Figure 5. LRRC8A knockdown reduces G. parasuis CdtABC-induced NPTr apoptosis. NPTr cells were pre-treated with 25 nM LRRC8A siRNA or 25 nM scramble siRNA for 24 h prior to expose to 500 ng/mL CdtABC for another 36 h. (a) the interference efficiency of LRRC8A siRNA was measured using qRT-PCR. Scramble siRNA serves as a negative control. (b) the activity of apoptosis factor caspase-3 was measured in NPTr cells. (c) expression of p-p53, p53, and BAX relative to GAPDH in NPTr cells were analyzed using Western blot. Band intensity ratios were calculated from Western blot and values give relative to control cells. The statistical significance of the indicated P values was determined as: *P < 0.05, **P < 0.01, ***P < 0.001. All data shown are representative of at least three independent experiments.
Figure 6. LRRC8A knockout reduces G. parasuis CdtABC-induced NPTr apoptosis. wild-type NPTr cells or LRRC8A–/– NPTr cells were treated with CdtABC for 36 h. (a) LRRC8A–/– NPTr cell line was established by CRISPR/Cas9-mediated genome editing. Two gRNAs matching the sequences flanking the exon 3 were used to achieve deletion of a large genomic fragment containing the exon 3. The upper panel shows the relevant part of LRRC8A genome structure, and the lower panel shows the sequences of the targeted region. (b) the percentage of apoptotic cells in NPTr cells was measured using flow cytometry. (c) the activity of apoptosis factor caspase-3 was measured in NPTr cells. (d) expression of p-p53, p53, and BAX relative to GAPDH in wild-type NPTr cells and LRRC8A–/– NPTr cells were analyzed using Western blot. GAPDH expression is the loading control. The statistical significance of the indicated P values was determined as: *P < 0.05, **P < 0.01, ***P < 0.001. All data shown are representative of at least three independent experiments.
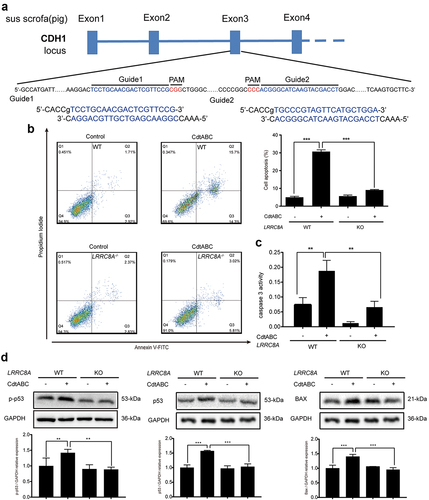
Figure 7. Re-expression of Sus scrofa LRRC8A in LRRC8A–/– NPTr cells restores CdtABC-induced apoptosis. wild-type NPTr cells, LRRC8A–/– NPTr cells, and LRRC8A rescued cells were treated with CdtABC for 36 h. (a) identification of LRRC8A and pcDNA3.1-LRRC8A using PCR. (b) Sus scrofa LRRC8A was stably expressed in the knockout cells and its expression levels were measured using qRT-PCR. (c) the activity of apoptosis factor caspase-3 was measured in wild-type NPTr cells, LRRC8A–/– NPTr cells, and LRRC8A rescued cells. (d) expression of p-p53, p53, and BAX relative to GAPDH in wild-type NPTr cells, LRRC8A–/– NPTr cells, and LRRC8A rescued cells. Band intensity ratios were calculated from Western blot and values give relative to control cells. The statistical significance of the indicated P values was determined as: *P < 0.05, **P < 0.01, ***P < 0.001. All data shown are representative of at least three independent experiments.
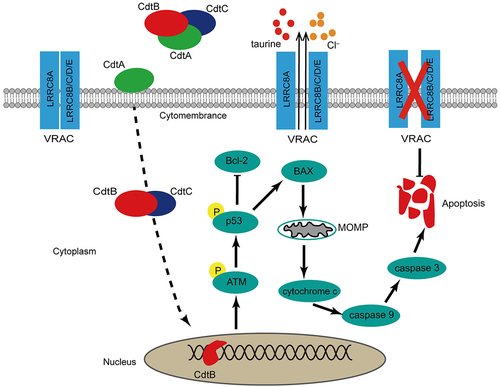
Figure 8. The important role of LRRC8A plays in G. parasuis CdtABC-induced apoptosis. the dash line indicates that CdtABC is internalized into the cell followed by the relocation of CdtB to the nucleus through an unknown pathway. As possessing DNase activity, CdtB brings about DNA double-strand breaks (DSB), which leads to DNA damage response. Induction of apoptosis via p53 pathway is generally elicited by CdtABC exposure as DNA damage. Activation of p53 decreased the expression of anti-apoptosis factor Bcl-2 and increased the expression of pro-apoptosis factor BAX, leading to increased mitochondrial outer-membrane permeabilization, cytochrome c release, activation of caspase-9 and subsequent executer caspase-3. LRRC8A is also activated by pro-apoptotic stimuli. Activation of LRRC8A triggers cell shrinkage (apoptotic volume decrease) as Cl– and osmolyte efflux through CdtABC-activated VRAC, which is essential for the phosphorylation of p53 and the progression of apoptosis. Thus, LRRC8A promotes the pro-apoptosis effect of CdtABC.
Data availability statement
The datasets generated for this study are available on request to the corresponding author.