
Figures & data
Table 1. Bacterial strains, plasmids, and primers used in this study.
Figure 1. Bioinformatics analysis of S. suis SspA-1 and SspA-2. (a) Diagrams illustrating the structure features of SspA-1 and SspA-2. Both SspA-2 and SspA-1 contained subtilisin-like serine peptidase typical domains: peptidase S8 family Streptococcal C5a peptidases domain (Peptidase_S8, SspA-1_Peptidase_S8: 156-638 a.a., SspA-2_Peptidase_S8: 237-722 a.a.), fibronectin type-III domain (fn3_like, SspA-1_fn3_like: 652-762 a.a., SspA-2_ fn3_like: 737-852 a.a.), protease associated (PA) domain located at Peptidase_S8 domain existed in proteins like Streptococcus pyogenes C5a peptidase and cell wall-anchored motif LPXTG at the end of C-terminus. SP: signal peptide. Truncated SspA-1T and SspA-2T were showed as red colour. (b) Representation of SspA-1 coding genes, B9H01_RS03985 and B9H01_RS03990 in S. suis SC-19. Incorrect annotation of the gene encoding the SspA-1 occurred due to a cytosine deletion causing a premature stop codon, resulting in the emergence of two ORFs: B9H01_RS03985 and B9H01_RS03990, in S. suis SC-19, distinct from SSU_RS009530 in S. suis P1/7. (c) Multiple Sequence Alignment of SspA-1 and SspA-2 with known Streptococcal C5a peptidases. The sites of Ser/His/Asp catalytic triad are marked above using asterisks (*).
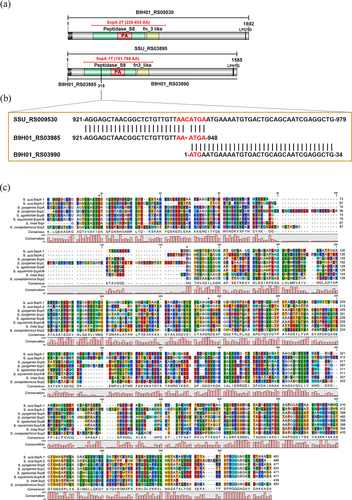
Table 2. Sequence identity alignment of the amino acid (a.a.) sequences of S. suis SC-19 SspA-1 with known C5a proteases from other species.
Table 3. Sequence identity alignment of the a.a. sequences of S. suis SC-19 SspA-2 with known C5a proteases from other species.
Figure 2. Intracellular co-localization of SspA-1 and SspA-2 with C3a and C5a protein. Immunofluorescence images depicting HA_SspA-1T (red), HA_SspA-2T (red), Myc_C3a (green) and Myc_C5a (green) proteins within HEK-293T cells. The nucleus is marked with DAPI staining (blue). Evident co-expression of SspA-1T or SspA-2T with C3a or C5a in the cytoplasm is observed in merged images. Co-localization is affirmed by the convergence of signals, manifesting as overlapping yellow regions.
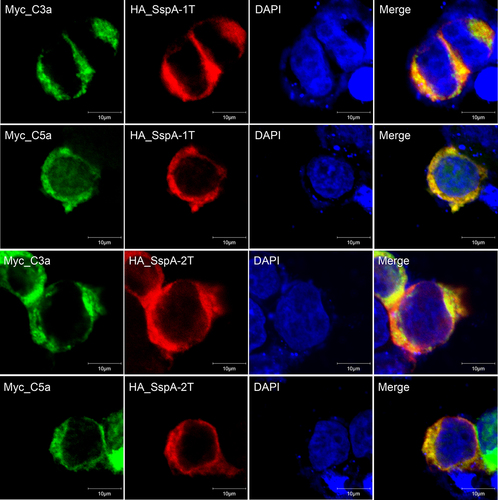
Figure 3. Interaction of SspA-1 and SspA-2 with complement C3a and C5a. The interaction between SspA-1 (a) or SspA-2 (b) and C3a and C5a was investigated using Co-Immunoprecipitation (Co-IP). HA_SspA-1T or HA_SspA-2T was co-transfected with Myc_C3a or Myc_C5a into HEK-293T cells, precipitated with anti-Myc antibody and immunoblotting with HA antibody to verify the protein-protein interaction. β-Tubulin served as a negative control. Protein extracts (Input) underwent SDS-PAGE after immunoprecipitation with HA or Myc antibody. To investigate C3a (c) and C5a (d) binding capacity and competitive binding capacity (e), ELISA experiments were conducted on SspA-1T-, SspA-2T-, and BSA-coated plates, with subsequent application of C3a or C5a. Recombinant SspA-1T and SspA-2T were applied to 10% SDS-PAGE and transferred onto PVDF membrane. The PVDF membrane was incubated with lysate of HEK-293T cell harbouring pCMV-Myc-c3a (f) or pCMV-Myc-c5a (g) and probed with an anti-Myc antibody for immunodetection. Statistical significance was determined by two-way ANOVA of Sidak’s correct for multiple comparison and indicated using asterisks (***p < 0.001).
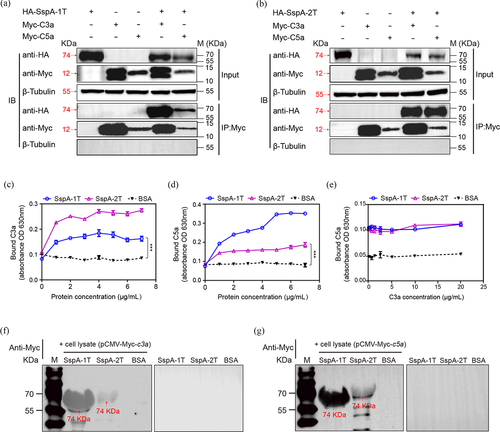
Figure 4. S. suis strains at stationary phase (4 × 10⁶ CFU) were incubated with GST_C3a_GFP (0.5 μg) or GST_C5a_GFP (0.5 μg) in TSB for 6, 12 and 16 hours. Protease inhibitor cocktail in GST_C3a_GFP or GST_C5a_GFP without S. suis strains was used as a negative control. Monoclonal antibodies specific for C3 or C5 were applied for C3a and C5a immunodetection, respectively.
Figure 5. Inhibition of THP-1 cell chemotaxis by recombinant SspA-1 and SspA-2. C3a or C5a was incubated with SspA-1 or SspA-2 to test the effect of SspA-1T (a) and SspA-2T (b) on chemotaxis by chemotaxis assay. Specifically, 10 nM C5a or C3a was incubated with 100 nM SspA-1 or SspA-2 for 30 min at 4 °C, and subsequently introduced into the lower chamber of a Transwell system. The upper chamber contained THP-1 cells to facilitate migration. The data were represented as means ± standard deviations (SD) from three independent experiments. Statistical significance was determined by two-way ANOVA of Sidak’s correct for multiple comparison and indicated using asterisks (***p < 0.001).
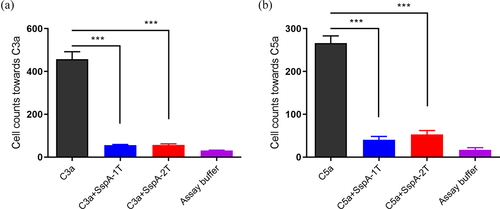
Figure 6. Survival activity of S. suis in blood and PMNs. (a) Survival rate of S. suis in swine blood was assessed. (b) Survival rate of S. suis in PMNs in the presence of active serum was evaluated. The data were represented as means ± standard deviations (SD) from three independent experiments. Statistical significance was determined by two-way ANOVA of Sidak’s correct for multiple comparison and indicated using asterisks (***p < 0.001; **p < 0.01; *p < 0.05; ns, p > 0.05).
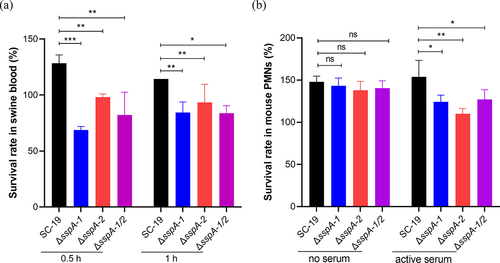
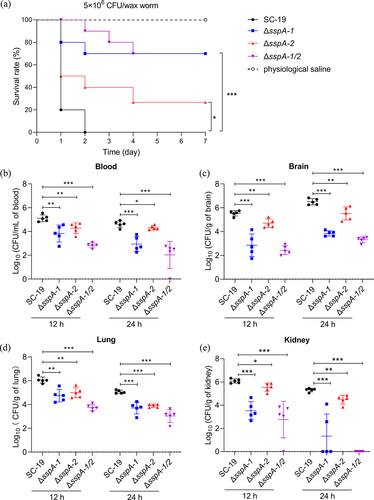
Figure 7. Impact of SspA-1 and SspA-2 on pathogenesis in murine and G. mellonella larvae infection models. (a) Survival curves of G. mellonella larvae challenged with S. suis. Larvae groups (n = 10) were administered with 1 × 10⁶ CFU of S. suis SC-19, ΔsspA-1, ΔsspA-2, or ΔsspA-1/2. Physiological saline served as a negative control. Log Rank test for trend was employed to assess survival discrepancies between groups. Bacterial loads in blood (b), brain (c), lung (d) and kidney (e) were determined. Seven mice per group were intraperitoneally infected with mixtures of S. suis at 1 × 10⁸ CFU/mouse. Results were shown as log10 of recovered bacterial counts after discarding the highest and lowest values (CFU/mL in Blood and CFU/g in organs). Statistical significance was determined by two-way ANOVA of Sidak’s correct for multiple comparison and indicated using asterisks (***p < 0.001; **p < 0.01; *p < 0.05).
Supplemental Materialclean.docx
Download MS Word (1.5 MB)Data availability statement
The data that support the findings of this study in this manuscript and its supplemental materials are available.