
Figures & data
Figure 1. Sequence analysis of the genomic region encoding HylA of S. suis and hyaluronidase activities of HylA and the products of truncated HylA. (a) Analysis of nucleic acid sequence of the genomic region encoding HylA of S. suis. Upper panel shows the sequence comparison of S. suis SC19 and another clinical isolate 0895. Letters with yellow shading highlight the differences in these two sequences. The region encoding HylA in the SC19 genome was split into four genes (h1215, h1214, hylS’ and h1212) as indicated in the sequences and in the gene location figure in the lower panel. (b) Hyaluronidase activities of different S. suis strains. Compared with the strain 0895 with intact hylA and strain SC19hylA with intact hylA instead of truncated hylA, no halo around the growth area of SC19 could be observed, indicating that SC19 had no hyaluronidase activity. (c) Hyaluronidase activities of the proteins of H1212, HylS,’ H1214, H1215 and HylA when expressed in E. coli BL21. The genes encoding H1212, HylS,’ H1214, and H1215 were amplified from SC19 and the gene encoding intact HylA was amplified from 0895. The genes were cloned into plasmid pET28a and transformed into BL21. The hyaluronidase activities of BL21 containing different recombinant proteins were analysed. There was no halo around the growth area of BL21 and BL21 containing H1212, HylS,’ H1214 or H1215, indicating none of these proteins had hyaluronidase activity. BL21 containing intact HylA was used as the positive control. All the experiments were performed in triplicate.
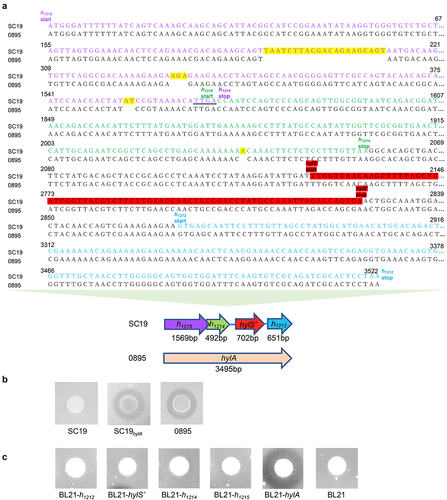
Figure 2. HylS’ and HylA interact with complement C3b. (a) Western ligand blotting was used to detect interaction of H1212, HylS,’ H1214, H1215 or HylA with C3b. Purified recombinant proteins GST- H1212, GST-HylS,’ GST-H1214, GST-H1215, and GST-HylA were separated by SDS-PAGE. One gel was visualized by Coomassie blue staining (a). The proteins present in a separate identical gel were transferred onto a PVDF membrane, incubated with C3b, then detected with anti-C3 antibody followed by incubation with HRP-conjugated goat-anti-mouse IgG (b). BSA and GST were used as negative controls. The final lane was protein His-C3b. (b) Pull-down assay was used to detect the interaction of HylS’ or HylA with C3b. Samples from bacterial cells expressing different recombinant proteins (100 μg per sample) were loaded onto glutathione resin columns, incubated with normal human serum (NHS), and analysed by SDS-PAGE after Coomassie blue staining (a) and western blotting using anti-C3b antibody (b). Protein His-C3b was used as the control. (c) ELISA detection of interaction of HylS’ and C3b. C3b was applied to HylS’- or BSA-coated plates to determine the C3b binding capacity (a). HylS’ was applied to C3b- or BSA-coated plates to determine the HylS’ binding capacity (b). Unpaired one-tailed Student’s t-test was used to do statistical analysis, ****p < 0.0001.
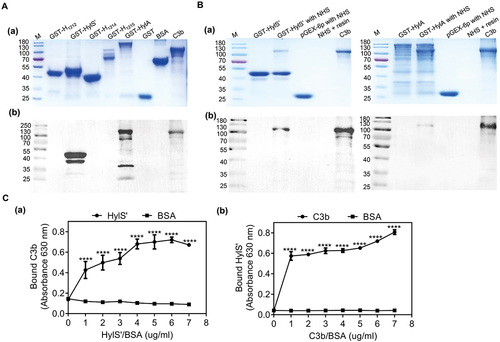
Figure 3. HylS’ is a secretory protein. The subcellular localization of HylS’ was determined by immunodetection of different components of bacteria. (a) Cell lysates, secreted proteins, and cell wall components were prepared from S. suis SC19 and subjected to western blot analysis using mouse anti-HylS’ polyclonal antibody, followed by HRP-conjugated goat-anti-mouse IgG. The band showed the size of protein HylS’ (27 kDa). (b) The secreted proteins of SC19 and the mutant ΔhylS’ were prepared and subjected to western blot analysis using mouse anti-HylS’ polyclonal antibody, followed by HRP-conjugated goat-anti-mouse IgG. The band showed the size of protein HylS’ (27 kDa). (c) The known cell wall anchored protein SntA was used as a control. Cell lysates, secreted proteins and cell wall components were prepared from S. suis SC19 and subjected to western blot analysis using mouse anti-SntA polyclonal antibody, followed by HRP-conjugated goat-anti-mouse IgG. The bands showed the size of SntA (91 kDa).
Figure 4. HylS’ inhibits C3b deposition and MAC on S. suis. (a) Flow cytometry histogram showing C3b deposition on S. suis. The same amount of SC19, SC19hylA, ΔhylS’, and CΔhylS’ were incubated with normal human serum and bacterial culture supernatants of each strain. The bacteria incubated with C3b antibody were mixed with FITC-conjugated goat-anti-mouse IgG, then washed and detected by flow cytometry analysis. (b) Histogram showing MAC formation on S. suis. The same amount of SC19, SC19hylA, ΔhylS’, and CΔhylS’ were incubated with normal human serum and bacterial culture supernatants of each strain were subjected to flow cytometry analysis. C5b-9 antibody was used as the first antibody and FITC-conjugate goat-anti-mouse IgG as the secondary antibody. (c-d) Geometric mean fluorescence intensity (GMF) values of C3b deposition (c) and MAC formation (d) on S. suis. Data are shown as mean values ± SD from three independent experiments. Statistical analyses were performed using the unpaired one-tailed Student’s t-test, ****p < 0.0001; ***p < 0.001.
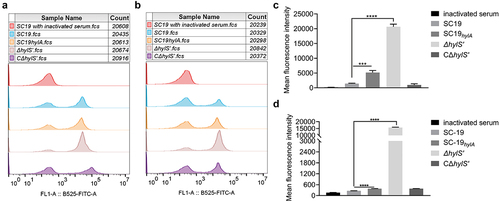
Figure 5. HylS’ enhances the survivability of S. suis in serum, blood and resistance to phagocytosis. (a) Survival of SC19, ΔhylS’ and CΔhylS’ in human serum. The same amount of bacteria were incubated with human serum for 25 min, and the bacterial numbers were determined by viable counting after serial dilution and plating on TSA plates. Inactivated serum was used as a negative control. Survival percentages of bacteria were calculated as (CFUactive serum /CFUinactivated serum) × 100%. (b) Survival of SC19, ΔhylS’ and CΔhylS’ in whole blood. The same amount of bacteria (CFUinput) were incubated with heparinized human whole blood for 60 min, and the bacterial numbers were determined (CFUoutput). Survival percentages of bacteria were calculated as (CFUoutput/CFUinput) × 100%. (c) The ability of SC19, ΔhylS’ and CΔhylS’ to resist phagocytosis. The same amount of bacteria (CFUinput) were incubated with mouse macrophage RAW264.7 cells at a MOI of 1:10 (cell to bacteria). RAW264.7 cells were lysed with saponin and the bacterial numbers were determined (CFUoutput). The relative number of live bacteria was calculated as (CFUoutput/CFUinput) × 100%. (d) The ability of SC19, ΔhylS’ and CΔhylS’ to resist neutrophils-mediated killing. The same amount of bacteria were incubated with human neutrophils (PMNs) separated from fresh human blood at a MOI of 1:10 (cells to bacteria) together with human normal serum or heat-inactivated serum. PMNs were lysed and the bacterial numbers were determined. The relative number of live bacteria was calculated as (CFUserum/CFUinactivated serum) × 100%. Data are shown as mean values ± SD from three independent experiments. Statistical analyses were performed using the unpaired one-tailed Student’s t-test, ****p < 0.0001; ***p < 0.001; **p < 0.01; ns, p > 0.05.
Figure 6. HylS’ contributes to the pathogenicity of S. suis. (a) Survival curves of mice infected with SC19 and ΔhylS’. Two groups of mice (n = 8) were injected intraperitoneally with 2 × 10⁹ CFU of SC19 or ΔhylS’. The Log Rank test was used to analyse the survival rates between different groups. **p < 0.01 (b) Bacterial loads in tissues of mice infected with SC19 and ΔhylS’. Two groups of mice (n = 6) were injected intraperitoneally with 5 × 10⁸ CFU of SC19 or ΔhylS’. Data are shown as mean values ± SD. Statistical analyses were performed using the unpaired one-tailed Student’s t-test, ****p < 0.0001; ***p < 0.001; **p < 0.01; *p < 0.05; ns, p > 0.05
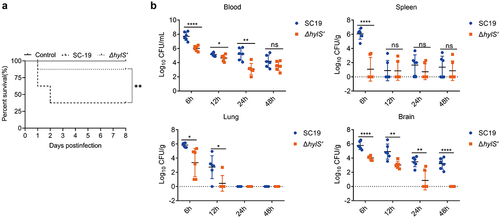
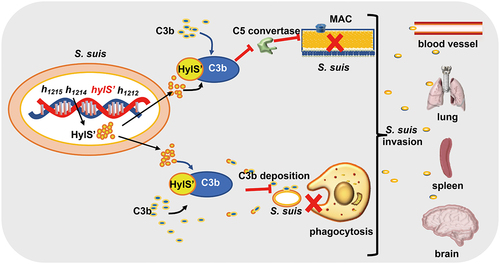
Figure 7. Model of HylS’-mediated complement evasion of S. suis. In the genome of S. suis strain SC19, the hylS’ gene is derived from the hyaluronidase-encoding hylA gene: HylS’ does not have hyaluronidase activity. HylS’ can interact with host complement C3b, leading to the inhibition of C3b deposition on the bacterial surface, blockade of C5 convertase synthesis, and ultimately less MAC formation on the bacterial surface. Bacteria with reduced C3b deposition are less likely to be recognized by receptors on the surface of macrophages and neutrophils, and are more resistant to phagocytosis. This strategy of complement evasion promotes bacteria to further invade host tissues and organs.
Supplemental Material
Download MS Excel (15.8 KB)Figure S1.jpg
Download JPEG Image (2.4 MB)
Figure S2.jpg
Download JPEG Image (12.6 MB)
Figure S3.jpg
Download JPEG Image (4.2 MB)
Data Availability statement
The data that support the findings of this study are openly available in Figshare at https://figshare.com/s/9c2cd1f3825b63f48891.