
Figures & data
Table 1. Baseline characteristics of patients with or without BPH expressed as median with interquartile range (n = 32).
Figure 1. Biodiversity indices across distinct groups of samples. (a) the species accumulation curve of the sample is used to judge whether the samples size is sufficient and estimate the species richness. (b) Shannon index reveals the alpha-diversity in prostate microbiome of BPH and normal tissues (p = 0.72, Wilcoxon rank sum test). (c) PCoA based on the Bray-Curtis distance shows the beta-diversity in prostate microbiome of BPH and normal tissues.
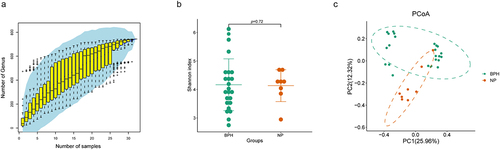
Figure 2. Bacterial composition of prostate tissue microbiome identified by metagenomic sequencing. (a) the bar plots are used to show the relative abundances of bacterial genera across various prostate tissue samples. (b) Heatmap of genus-level abundance in sequencing data, based on the Euclidean distance and complete-linkage hierarchical cluster. (c) dot plot showing the relative abundance (%) of Pseudomonas. (d) dot plot showing the relative abundance (%) of Escherichia. Wilcoxon rank sum test; **p < 0.01; ***p < 0.001.
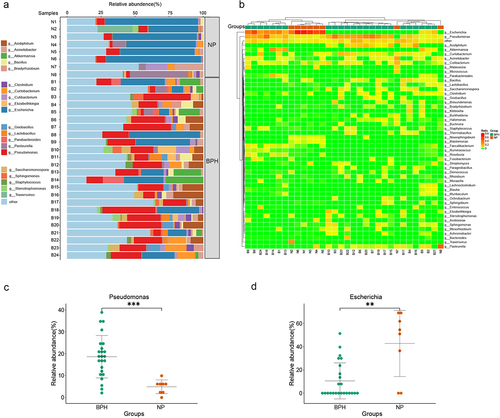
Figure 3. Comparisons of microbiome in prostate tissue and catheterized urine. Shannon index (a) shows alpha-diversity (p = 0.75; Wilcoxon rank sum test) and PCoA based on the Bray-Curtis distance (b) shows beta-diversity. (c) the relative abundances of bacterial genera in various samples shown in bar plots. (d) Heatmap of genus-level abundance in prostate tissue and catheterized urine, based on the Euclidean distance and complete-linkage hierarchical cluster.
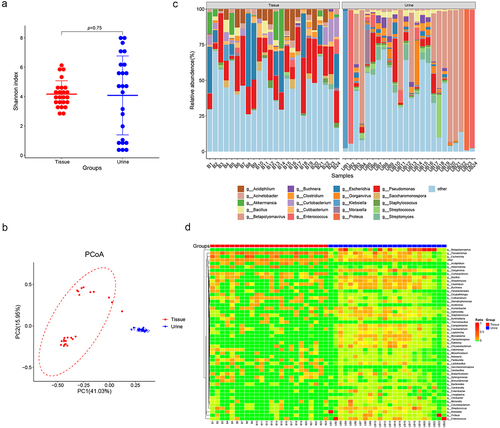
Figure 4. The presence of Pseudomonas and degree of inflammation in prostate tissues. (a) Representative FISH images of Pseudomonas in prostate tissues, and quantification of Pseudomonas probe reactivity comparing the percentage (%) of cells with perinuclear probe reactivity in BPH and normal prostate tissues. (b) Representative H&E staining images of prostate tissues. Representative images of IHC for COX-2 (c) and IL-6 (d) in prostate sections from BPH and normal groups. Quantification bar graph showing the extent of COX-2 and IL-6 staining in the form of mean density calculated by IOD/area. Data are shown as mean ± SD, Student’s t-test; ***p < 0.001.
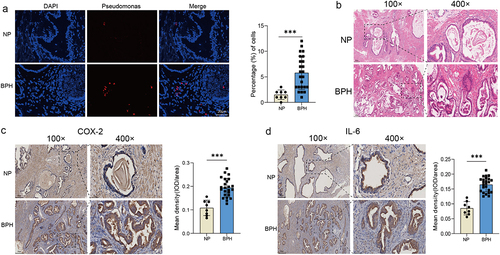
Figure 5. The increase of NF-κB expression in BPH tissues. (a) Volcano map of DEGs after urethral bacterial instillation based on GSE179655. blue dots: down-regulated genes; red dots: up-regulated genes; gray dots: no significant difference. (b) transcription levels of NF-κB by qRT-PCR in BPH and normal tissues. (c) Representative images of IHC for NF-κB in prostate sections from BPH and normal groups. Quantification bar graph showing the extent of NF-κB staining in the form of mean density calculated by IOD/area. Data are shown as mean ± SD, Student’s t-test; ***p < 0.001.
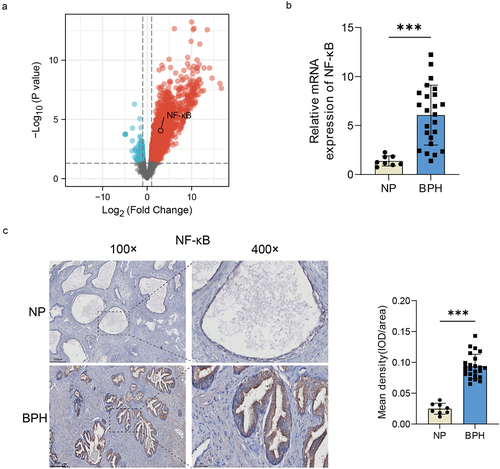
Figure 6. LPS of Pseudomonas affects the cell phenotypes via activating NF-κB. (a, b) BPH-1 cells were cultured by LPS (1 μg/ml) and/or BAY-11-7082 (5 μM) for 48 h, comparing with control cells; western blot and relative densitometric quantification for total and phosphorylated p65. (c) transcription levels of inflammatory cytokines by qRT-PCR at the above conditions. (d, e) western blot and relative densitometric quantification for proliferative protein (PCNA), apoptotic proteins (bcl-2, BAX) and EMT proteins (E-cadherin, N-cadherin, and vimentin). CCK-8 assay (f) and EdU assay (g, h) were used to analyze the cell proliferation of BPH-1 cells. (i) flow cytometry analysis was used to detect apoptotic cells stained with annexin V and PI, and the resulting apoptotic rates were subjected to statistical analysis (j). Data are shown as mean ± SD, one-way ANOVA; *p < 0.05, **p < 0.01, and ***p < 0.001: compared to the NC group; #p < 0.05, ##p < 0.01, and ###p < 0.001: compared to the LPS group.
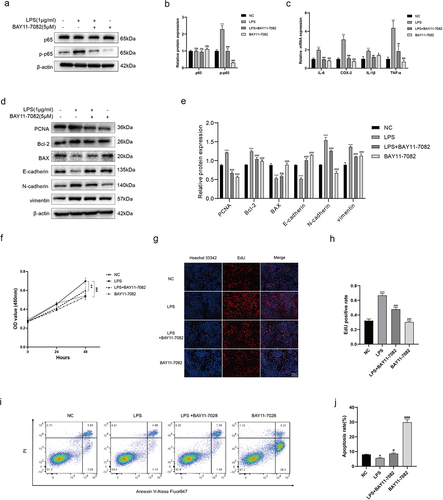
Table S1.xlsx
Download MS Excel (9.5 KB)Table S2.docx
Download MS Word (15.8 KB)Fig.S1.docx
Download MS Word (237.2 KB)FigS2.tif
Download TIFF Image (9.7 MB)Data availability statement
The sequencing data are available and have been uploaded to the National Center for Biotechnology Information (NCBI) under the BioProject ID PRJNA1061468.