
Figures & data
Figure 1. B5 activates macrophages. a, the effects of B5 on the viability in RAW264.7 cells. Cells were incubated with 10–80 µg/ml of B5 for 24 h, 48 h, or 72 h, and cell viability was detected using CCK8 solution. b, levels of TNF-α and IL-1β in B5-treated RAW264.7 cells. Cells were incubated with 5–40 µg/ml of B5 for 24 h. c, levels of TNF-α, IL-1β and IFN-β in bone marrow-derived macrophages (BMDMs) treated with B5 or poly IC. Data shown are means ± SD. Data are representative of three independent experiments (n = 3). The significance of differences between the groups was determined by ANOVA with post-hoc Tukey’s multiple comparison test (*p < 0.033, **p < 0.0021, ***p < 0.0002, ****p < 0.0001).
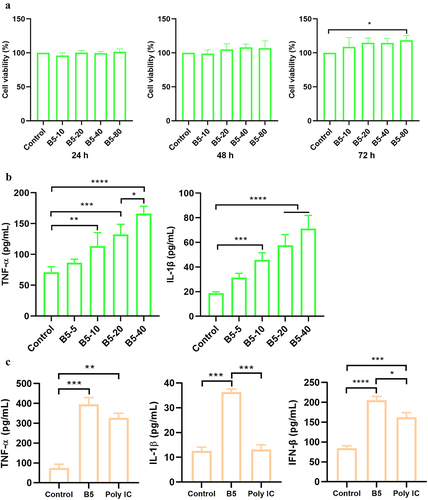
Figure 2. B5 promotes the maturation of functional DC. a, levels of TNF-α, IL-1β, and IFN-β in bone marrow-derived dendritic cells (BMDCs) stimulated with B5 or poly IC. b, expression levels of CD80, CD86, and MHC-II in BMDC stimulated with B5 or poly IC. Data shown are means ± SD. Data are representative of three independent experiments (n = 3). The significance of differences between the groups was determined by ANOVA with post-hoc Tukey’s multiple comparison test (*p < 0.033, **p < 0.0021, ***p < 0.0002, ****p < 0.0001).
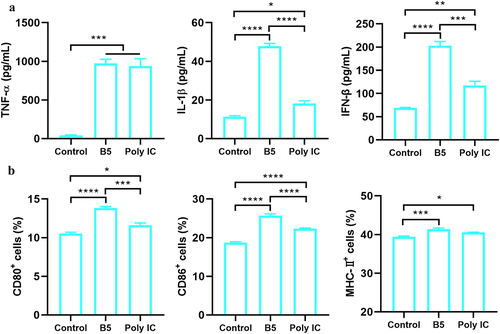
Figure 3. Intranasal B5 safety evaluation. a, schematic representation of treatment model. Mice were treated through intranasal route with 20 μg of B5 (twice, 2-d interval). Three days after the last treatment, mice were euthanized for safety evaluation. b, weight of lung and spleen tissues after treatment with B5. c, levels of TNF-α, IL-1β, IL-17, IL-22 and IL-23 in lungs. d, histopathological images of lungs performed with HE staining (left images scale bar: 300 μm; right images scale bar: 60 μm). Data shown are means ± SD. Data are representative of two independent experiments (n = 3 mice per group). The significance of differences between two groups was determined by Student’s t-test.
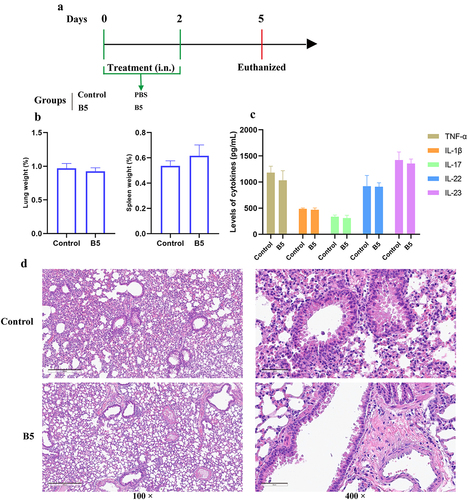
Figure 4. Intranasal B5 provides early protection against APP. a, schematic representation of pretreatment/challenge model. Mice were pretreated intranasally with 20 μg of B5 (twice, 2-d interval) and challenged with APP 3 d after the last pretreatment and euthanized for protective evaluation 6 h after challenge. b, body weight changes. c, weight of lung tissues. d, bacterial load in lungs. e, gross pathology of lungs. f, histopathological images of lungs performed with HE staining (left images scale bar: 300 μm; right images scale bar: 60 μm). Data shown are means ± SD. Data are representative of two independent experiments (n = 6 mice per group). The significance of differences between the groups was determined by ANOVA with post-hoc Tukey’s multiple comparison test (*p < 0.033, **p < 0.0021, ***p < 0.0002, ****p < 0.0001).
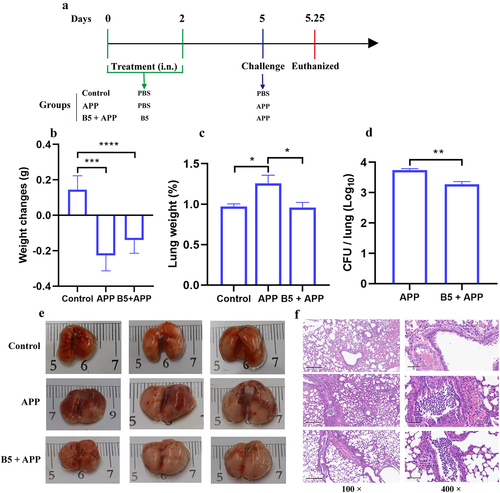
Figure 5. Intranasal B5 maintains protection in the later stage of APP infection. a, schematic representation of pretreatment/challenge model. Mice were pretreated intranasally with 20 μg of B5, challenged with APP 3 d after the last pretreatment, and euthanized for protective evaluation 24 h after challenge. b, body weight changes. c, weight of lung tissues. d, bacterial load in lungs. e, gross pathology of lungs. f, histopathological images of lungs performed with HE staining (left images scale bar: 2 mm; middle images scale bar: 300 μm; right images scale bar: 60 μm). Data shown are means ± SD. Data are representative of two independent experiments (n = 6 mice per group). The significance of differences between the groups was determined by ANOVA with post-hoc Tukey’s multiple comparison test (**p < 0.0021, ***p < 0.0002).
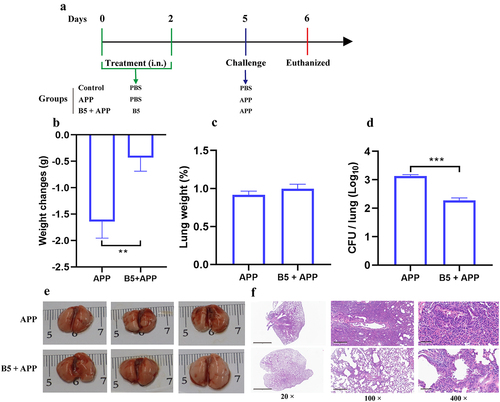
Figure 6. Intranasal B5 promotes cytokine secretion in lungs during APP infection. Mice were pretreated intranasally with 20 μg of B5, challenged with APP 3 d after the last pretreatment, and euthanized for cytokines detection 6 h and 24 h after challenge. a-e, levels of TNF-α (a), IL-1β (b), IL-17 (c), IL-22 (d), and IL-23 (e) in lungs. f-i, levels of TNF-α (f), IL-1β (g), IL-17 (h), and IL-22 (i) in BALF. j, protein levels in BALF. Data shown are means ± SD. Data are representative of two independent experiments (n = 3–4 mice per group). The significance of differences between the groups was determined by ANOVA with post-hoc Tukey’s multiple comparison test (*p < 0.033, **p < 0.0021, ***p < 0.0002, ****p < 0.0001).
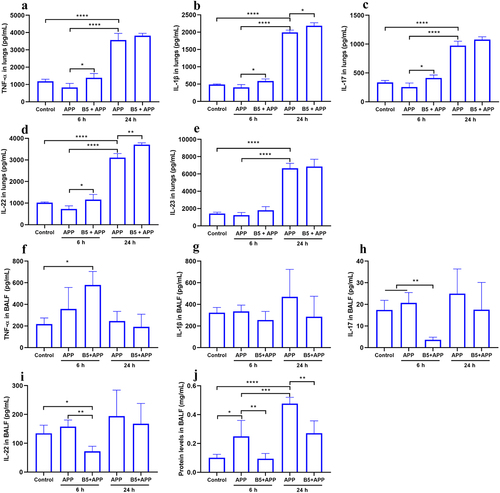
Figure 7. Intranasal B5 induces the generation of innate immune cells in lungs. Mice were pretreated intranasally with 20 μg of B5, challenged with APP 3 d after the last pretreatment, and euthanized for innate immune cells detection 6 h after challenge. a, Representative FACS blots of DC (CD11c+), macrophages (F4/80+), neutrophils (Ly6G+), ILC3s (Lineage− Rorγt+), and Lineage+ Rorγt+ cells in lungs. b-f, percentage of DC (b), macrophages (c), neutrophils (d), ILC3s (e), and Lineage+ Rorγt+ cells (f). Data shown are means ± SD. Data are representative of two independent experiments (n = 4–6 mice per group). The significance of differences between the groups was determined by ANOVA with post-hoc Tukey’s multiple comparison test (*p < 0.033, **p < 0.0021, ***p < 0.0002, ****p < 0.0001).
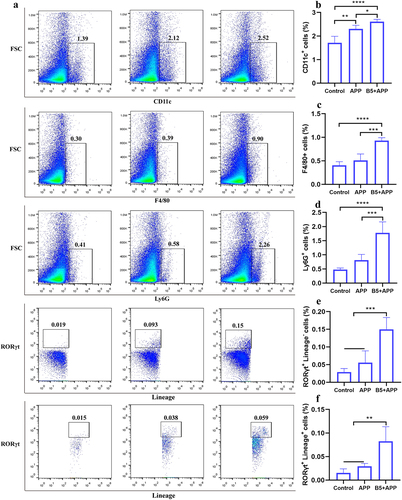
Figure 8. Analysis of differentially expressed genes. a, differentially expressed genes were shown in volcano plots (B5 + APP group vs APP group). b, representative differentially expressed genes were shown in heat map.
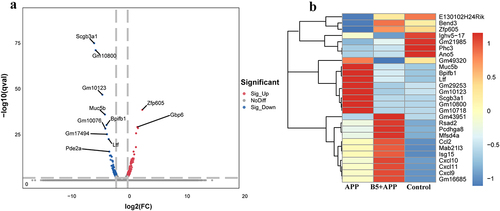
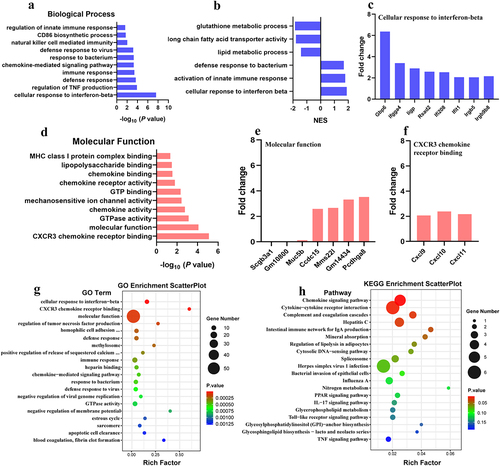
Figure 9. Gene ontology (GO) term analysis of differentially expressed genes. B5 + APP group vs APP group: a, gene enrichment in biological process. b, gene set enrichment analysis (GSEA). c, fold changes of genes involving cellular response to interferon-beta d, gene enrichment in molecular function. e-f, fold changes of genes involving molecular function (e) and CXCR3 chemokine receptor binding (f). g-h, GO enrichment scatterplot (g) and KEGG enrichment scatterplot (h).
3-Supplementary information.docx
Download MS Word (210.1 KB)Data Availability statement
The data that support the findings of this study are available from the corresponding author upon reasonable request ([email protected]).