
Figures & data
Figure 1. vEVs contain high abundance of virulence factors and energy metabolism proteins. Granulomatous lesions were extracted from two to four mice from three independent infections at eight weeks and 12 weeks after infection with 1 × 10⁶ P. brasiliensis yeasts. After culturing the fungus extracted from the lesions, EVs were isolated, and their protein content was extracted and digested with trypsin and resolubilized in 0.1% formic acid. Peptides were analysed by LC-MS/MS and proteins were identified by MaxQuant software. Proteins containing more than two unique peptides had their intensity normalized by log2 followed by quantile normalization within each experimental group. Then, a differentially abundant protein analysis was made using limma and a functional analysis was carried out. To illustrate the differentially abundant proteins of the EVs, a volcano plot of the 8-weeks infection (8W – vEVs) group in relation to the control EVs (a) and a volcano plot of the 12-weeks infection group (12W – vEVs) in relation to the control EVs (b) were made. Additionally, a heatmap was created with selected proteins (c). The proteins in red represent a higher abundance. The functions of the more abundant proteins (d), and the protein found exclusively in the vEVs proteins (e) were taken using GO, KEGG, and FungiDB.
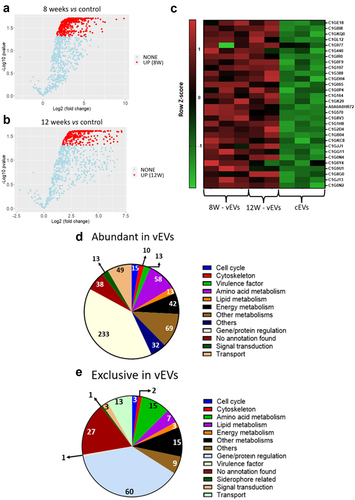
Table 1. Selected proteins abundant in vEvs.
Table 2. Selected proteins exclusive in vEvs.
Figure 2. vEVs induce high expression of TLR4 and dectin-1 but low expression of TLR2 in DCs and macrophages. Antigen-presenting cells obtained from the bone marrow cells of C57BL/6 mice, which were differentiated with GM-CSF (20 ng/mL), were challenged with different concentrations of P. brasiliensis control and virulent EVs (107, 108, and 109 EVs/mL) for 48 hours. The cells were then recovered and labelled with fluorochrome-conjugated antibodies. Flow cytometry using FACSLyric and FlowJo software was used to analyse the frequency of DCs (CD11b+CD11c+F4/80−; left) and macrophages (CD11b+CD11c+F4/80+; right) expressing TLR2 (a), TLR4 (b), and dectin-1 (c). The bars represent means ± standard error of triplicates per group (*p < 0.05; **p < 0.01; ***p < 0.001; ****p < 0.0001). As a negative control (CTL), cells received only RPMI medium, while LPS (1 µg/mL) was used as positive control.
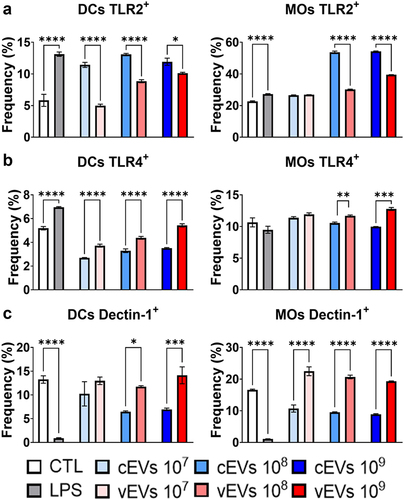
Figure 3. vEVs promote compromised maturation of DCs and macrophages than cEvs. Antigen-presenting cells obtained from the bone marrow cells of C57BL/6 mice, which were differentiated with GM-CSF (20 ng/mL), were challenged with different concentrations of P. brasiliensis control and virulent EVs (107, 108, and 109 EVs/mL) for 48 hours. The cells were then recovered and labelled with fluorochrome-conjugated antibodies. Flow cytometry using FACSLyric and FlowJo software was used to analyse the frequency of DCs (CD11b+CD11c+F4/80−; left) and macrophages (CD11b+CD11c+F4/80+; right) expressing CD40 (a), CD80 (b), CD86 (c), and MHC II (d). The bars represent means ± standard error of triplicates per group (*p < 0.05; **p < 0.01; ***p < 0.001; ****p < 0.0001). As a negative control (CTL), cells received only RPMI medium, while LPS (1 µg/mL) was used as positive control.
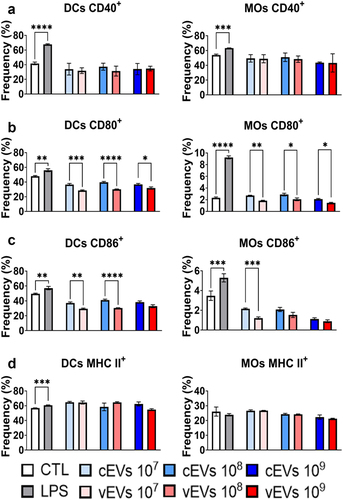
Figure 4. vEVs enhance the expression of intracellular IL-6 and IL-10 when compared to expression stimulated by cEVs. Antigen-presenting cells obtained from the bone marrow of C57BL/6 mice, which were differentiated with GM-CSF (20 ng/mL), were challenged with different concentrations of P. brasiliensis control and virulent EVs (107, 108, and 109 EVs/mL) for 48 hours. The cells were then recovered and labelled with fluorochrome-conjugated antibodies. Flow cytometry using FACSLyric and FlowJo software was used to analyse the frequency of DCs (CD11b+CD11c+F4/80−; left) and macrophages (CD11b+CD11c+F4/80+; right) expressing IL-6 (a), IL-10 (b), and TNF-α (c). The bars represent means ± standard error of triplicates per group (*p < 0.05; **p < 0.01; ***p < 0.001; ****p < 0.0001). As a negative control (CTL), cells received only RPMI medium, while LPS (1 µg/mL) was used as a positive control.
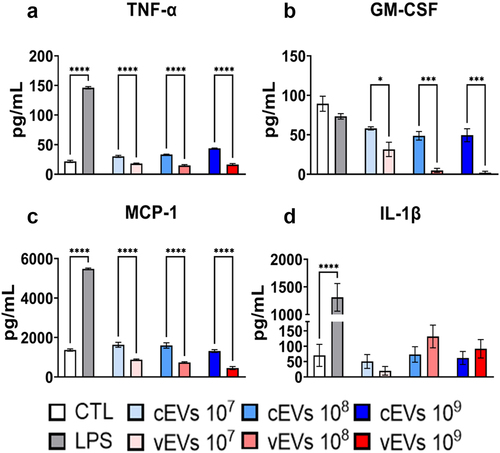
Figure 5. Antigen-presenting cells secrete lower levels of MCP-1, GM-CSF, and TNF-α when stimulated with vEVs than cEVs. Antigen-presenting cells obtained from the bone marrow of C57BL/6 mice, which were differentiated with GM-CSF (20 ng/mL), were challenged with different concentrations of P. brasiliensis control and virulent EVs (107, 108, and 109 EVs/mL) for 48 hours. The supernatant was collected and the levels of MCP-1 (a), GM-CSF (b), TNF-α (c), and IL-1β (d) were dosed by ELISA. The bars represent means ± standard error of triplicates per group (*p < 0.05; ***p < 0.001; ****p < 0.0001). As a negative control (CTL), cells received only RPMI medium, while LPS (1 µg/mL) was used as positive control.
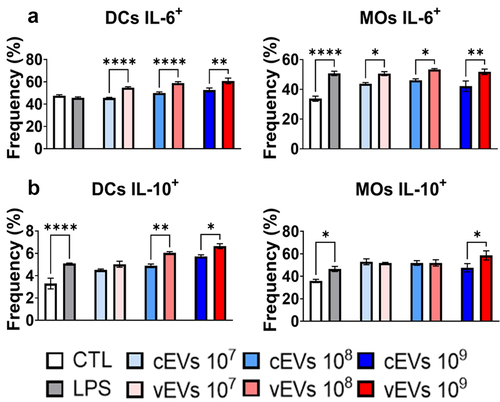
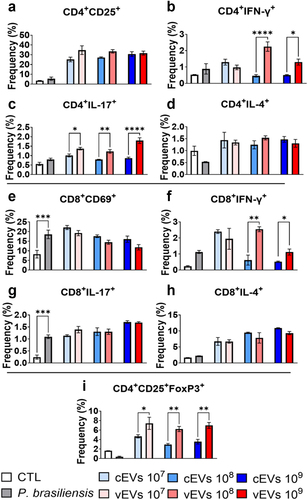
Figure 6. Dendritic cells primed with vEVs induce a higher frequency of Th1/Th17 cells compared to DCs primed with cEVs. Antigen-presenting cells obtained from the bone marrow of C57BL/6 mice, which were differentiated with GM-CSF (20 ng/mL), were challenged with different concentrations of P. brasiliensis control and virulent EVs (107, 108, and 109 EVs/mL) for 48 hours. The cells were then placed in co-culture with lymphocytes obtained from the spleen (1 DC/Macrophage : 10 lymphocytes) of naive mice for 5 days. The cells were then recovered and labelled with fluorochrome-conjugated antibodies. Flow cytometry using FACSLyric and FlowJo software was used to analyse the frequency of activated CD4+ lymphocytes (a), Th1 (b), Th2 (c), Th17 (d), activated CD8+ (e), Tc1 (f), Tc2 (g), Tc17 (h), and Treg (i) profiles. The bars represent means ± standard error of triplicates per group (*p < 0.05; **p < 0.01; ***p < 0.001; ****p < 0.0001). As a negative control (CTL), cells received only RPMI medium, while P. brasiliensis (2000 cells; 1 P. brasiliensis : 50 innate cells) was used as a positive control.
Supplemental Material
Download Zip (3.7 MB)Data Availability statement
Proteome data are available via ProteomeXchange with identifier PXD046549. Any other data are available upon request.