
Figures & data
Table 1. Primers used in this study.
Table 2. Bacterial strains and plasmids used in this study.
Figure 1. PagN production is induced under culture conditions mimicking the intravacuolar lifestyle of Salmonella. Production of PagN 3×FLAG in STm WT after culture (a) in LB or (b) in LPM was estimated. 2 x 10⁸ bacteria were denatured and the protein level and the production of PagN was verified by Western blotting as described in Methods. The images are representative of two independent experiments.
Figure 2. PagN is produced during CHO cells infection. CHO cells were infected with STm PagN x3FLAG at MOI 50:1 for 1 h at 37 °C followed by 1 h with gentamicin 100 µg/mL and extra time with gentamicin 10 µg/mL corresponding to 2.5, 6 and 24 h p.i. At the indicated time, Laemmli buffer resuspension of the bacterial inoculum (representing 1.5 x 10⁶ bacteria in 10 µL), of the uninfected or of cell culture supernatant containing extracellular bacteria 1 h p.i. Or of the infected cells were loaded as described in Methods. The bacterial protein level BamB and the production of PagN have been verified by immunoblotting. The image is representative of three independent experiments.
Figure 3. PagN is produced in the SCV. (a) STm WT, STm WT p4889 and STm WT pOGv2 were cultured in (blue marks) medium with normal concentration of phosphate and magnesium and neutral pH named NPM or were cultured in (red marks) LPM medium with low concentration of phosphate and magnesium and acidic pH (5.8). To estimate pagN transcription at the indicated time (hours) relative intensity of eqFP650 fluorescence of measured OD600nm liquid cultured of (dot) STm WT, (square) STm WT p4889 and (triangle) STm WT pOGv2 were recorded with Tecan Fluorescence microplates reader. (b) CHO cells were infected with STm WT pOGv2 at MOI 50:1 for 1 h at 37°C followed by 1 h with gentamicin 100 µg/mL and extra time with gentamicin 10 µg/mL correspond to 24 h p.i. then fixed and stained with mouse LAMP2 antibody, then revealed with anti-mouse Alexa Fluor 405 (blue). Imaging was performed using confocal microscopy with a 100 × oil immersion objective (Leica TCS SP8, Germany). Vacuolar spaces were LAMP2 positive (blue) vacuolar Salmonella were visualized in yellow (DsRed constitutive: yellow), hyper replicative cytosolic Salmonella were observed red and weakly yellow (sfGFP inducible: green and DsRed constitutive: weakly yellow due to hyper replication), and Salmonella PpagN transcriptionnaly active were red (PpagN::eqFP650: red). Continuous white square named Z1 representing vacuolar bacteria or dashed white square named Z2 representing cytosolic bacteria were oversized 2.4 times and 5 times for merged images. Scale bars 10 µm. (c) Quantification of vacuolar or cytosolic Salmonella with PpagN transcriptionnaly active from CHO cells infected with STm WT pOGv2 at MOI 50:1 for 1 h at 37°C followed by 1 h with gentamicin 100 µg/mL and extra time with gentamicin 10 µg/mL correspond to 24 h p.i. then fixed. Images obtained using confocal microscopy with a water-immersion 63× objective (Leica TCS SP8, Germany) were analyzed with a script described in Methods.
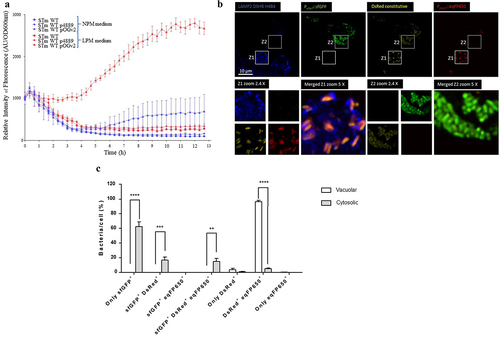
Figure 4. PagN is produced in SCV during CHO cells infection. CHO cells were infected with STm PagN x3FLAG p4889 at MOI 50:1 for 1 h at 37°C followed by 1 h with gentamicin 100 µg/mL and extra time with gentamicin 10 µg/mL corresponding to 24 h p.i. At the indicated time, cells were lysed and Salmonella were rescued and sorted by Fluorescence-activated cell sorting. Two populations were sorted Salmonella DsRed without sfGFP (vacuolar Salmonella) and DsRed with GFP (cytosolic Salmonella). Then, 15 µL over 100 µL of Laemmli buffer resuspension (representing 3 x 10⁵ bacteria) were loaded as described in Methods. The bacterial protein level BamB and the production of PagN have been verified by immunoblotting. These images are representative of two independent experiments.
Figure 5. PagN leads to the cytosolic presence of Salmonella. CHO cells were infected (black bars) with STm WT or (empty bars) with STm ∆pagN strain or (grey bars) with STm ∆pagN + PagN complemented (pSUP202 pagN) at 37 °C for 1 h at MOI 10:1, (a) followed by the addition of gentamicin (100 μg/mL) added to chloroquine (400 µM) for 1.5 h or (b) followed by a further 21.5 h with gentamicin (10 µg/mL) added to chloroquine (400 µM) 1 h before the end of experiment. The percentage of cytosolic bacteria (a) at 2.5 h p.i. And (b) at 24 h p.i. and (c) the replication rate has been calculated as described in Methods. Data show mean values ± SEM acquired from three independent experiments with three infected wells per experiment. (****p < 0.0001, ***p < 0.001, **p < 0.01, *p < 0.05, ns: non-significant).
Figure 6. PagN acts on the late cytosolic fate of S. Typhimurium in CHO cells. CHO cells were infected with STm WT p4889 strain (black bars) or with STm ∆pagN p4889 strain (white bars) at 37 °C for 1 h at MOI 10:1 followed by the addition of gentamicin (100 μg/mL) for 1.5 h then followed by a further 21.5 h with gentamicin (10 µg/mL). After trypsinization, cells at (a) 2.5 h and (b) 24 h p.i. were analysed by flow cytometry gated for only vacuolar bacteria (DsRed) or cytosolic bacteria (DsRed + sfGFP). The percentage of cells with cytosolic bacteria at 2.5 h p.i. and at 24 h p.i. has been calculated and compared between STm WT and STm ∆pagN. Data show mean values ± SEM acquired from three independent experiments with three infected wells per experiment. (**p < 0.01, ns: non-significant).
Figure 7. PagN production affects S. Typhimurium intracellular replication and localization within intestinal epithelium. 3D organoids were dissociated, seeded on Transwell® permeable supports and grown into a differentiated 2D organoid monolayer. 2D organoid monolayers were infected with STm WT, ΔpagN mutant or with the STm ∆pagN + PagN complemented (pSUP202 pagN) strains for 1 h. Quantification of (a) the percentage of internalized bacteria at 2.5 h p.i., (b) the bacterial replication level and (c) the percentage of cytosolic bacteria at 24 h p.i. per Transwell®. Graphs show the mean ± SEM of at least two independent experiments with four Transwells® evaluated for each experiment (***p < 0.001, *p < 0.05, ns: non-significant).
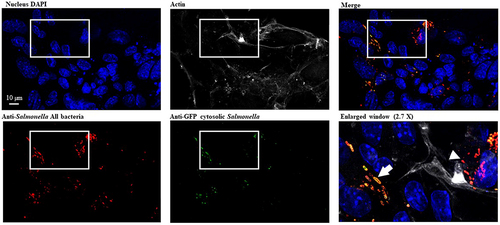
Figure 8. S. Typhimurium intracellular localization within intestinal epithelium. 3D organoids were dissociated, seeded on Transwell® permeable supports and grown into a differentiated 2D organoid monolayer. 2D ileum organoïds were infected with STm WT p4889 for 1.5 h at 37 °C followed by 1.5 h with gentamicin 100 µg/mL and extra time with gentamicin 10 µg/mL correspond to 24 h p.i. then fixed and stained with DAPI for nucleus (blue), Phalloïdin Alexa Fluor 647 for actin (grey), Salmonella antibody detected with goat anti-rabbit Alexa Fluor 568 (red) and anti-GFP conjugated Alexa Fluor 488 (green). Imaging was performed using confocal microscopy with a water-immersion 63× objective (Leica TCS SP8, Germany). On three time enlarged window vacuolar Salmonella were visualized red targeted by white arrow head (DsRed constitutive: red) and hyper-replicative cytosolic Salmonella were observed mixed red/yellow targeted by white arrow (corresponding to colocalization of sfGFP inducible (green) and DsRed constitutive (red)). Scale bar 10 µm.
Supplemental Material
Download Zip (252.8 KB)Data availability statement
The authors confirm that the data supporting the findings of this study are available in the article and its supplementary materials or by consulting this link https://doi.org/10.57745/W1XELF.