
Figures & data
Figure 1. Comparison analysis of 42 ICEHin1056 family ICEs.
Phylogenetic trees of the conserved structures of 42 ICEHin1056 family ICEs and their collinear alignment. The three colours represent the three subtypes of ICEHin1056-like ICEs in P. multocida in the phylogenetic tree, of which the blue section represents all Asia P. multocida, while the grey section represent Europe and the Americas strains, indicating significant systematic branch differences according to geographical location. In the collinear alignment of the complete structure of ICEs, the same colour blocks represent the same ICEs conservative structure, while the ICEs variable region with different colour blocks also differ according to geographical locations.
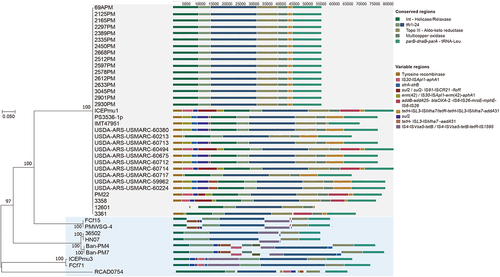
Figure 2. T4SS of 42 ICEHin1056 family ICEs in P. multocida.
Phylogeny and sequence alignment of T4SS in 42 ICEHin1056-like ICEs. The phylogenetic relationship of T4SS of 42 ICEs was clustered according to geographical distribution as same as , among which the strains in dark red font are isolated from Europe and Americas, and the green font are isolated from Asia. The different colours blocks represent the alignment situation of tfc1-24 in T4SS, and the T4SS of ICEs in Asia P. multocida is noticeably different from the Europe and the Americas
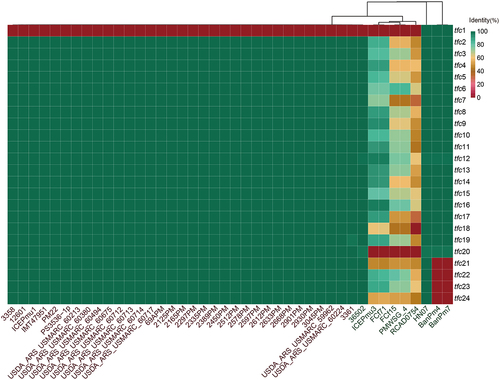
Figure 3. Collinear alignment of SXT/R39 family ICEs and Tn916 family ICEs.
a. Collinear alignment of two SXT/R391 family ICEs in P. multocida and their similarities, ICEPmiCHN3300 in Vibrio cholerae and ICEVchBan9 in Bacillus mirabilis; b. Collinear alignment of one Tn916 family ICE in P. multocida and its similarity, CTn2 of Clostridium difficile. The ICEs conserved regions are in red, and the ICEs variable regions are in green.
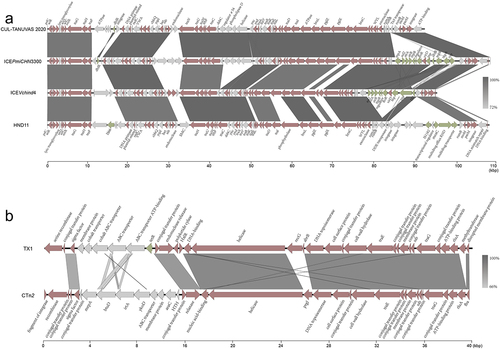
Figure 4. Module structure of resistance genes of ICEs in P. multocida.
The resistance genes of ICEs in P. multocida mainly exist in the form of three modules. A. ISL3-ISMha7 resistance modules; B. IS30-ISApl1 resistance module; C. IS4-ISVsa5 resistance module.
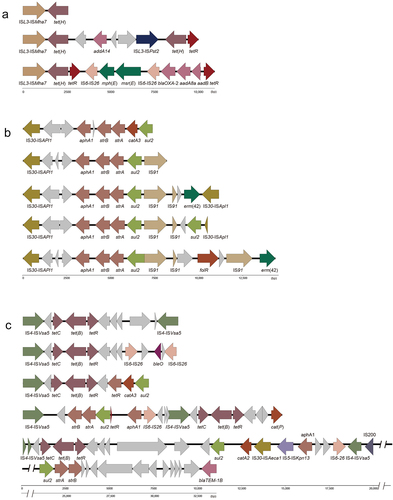
Figure 5. Prevalence analysis of ICEs in P. multocida.
The transmission of ICEs in P. multocida from 1899 to 2022 is temporally biased. a. The split violin plot between their ICEs and P. multocida in Europe and the Americas, and Asia, shows that transmission of ICEs occurred at the mainly prevalence times of P. multocida in these areas. b. The violin plot of P. multocida containing ICEs in Europe and the Americas, and Asian, indicates that Europe and the Americas P. multocida containing ICEs were mainly transmitted in large numbers from 2010 to 2013, while the Asian mainly from 2015 to 2018. The presence of multi-host P. multocida and their ICEs is shown in C and D, with the key colours on the left side. The Y-axis is the proportion of a certain host-sourced P. multocida in this type of host-sourced strains, while the X-axis is the strains isolation time. The rug plot shows the corresponding clinical strains isolated in that year. C. Time distribution and the rug plot of 302 multi-host-sourced P. multocida; D. Time distribution and the rug plot of 82 multi-host-sourced P. multocida containing ICEs. The cattle and poultry-sourced P. multocida and their ICEs have the longest time distribution, followed by the pig-sourced strains
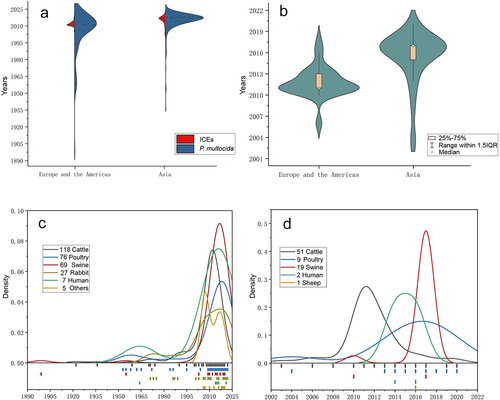
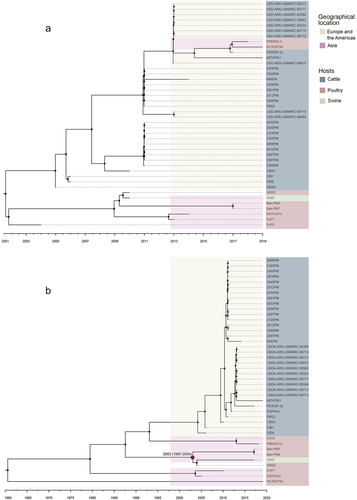
Figure 6. The Bayesian tree of ICEs and P. multocida.
The Bayesian tree analysis of whole genomes of P. multocida and its associated ICEs demonstrated horizontal and vertical transmission patterns of ICEs in P. multocida. a. Bayesian tree of whole genomes of 42 P. multocida strains with ICEHin1056-like ICEs; b. the Bayesian tree of 42 ICEHin1056-like ICEs. The geographical location and host source of each strain are indicated by different colours on the right, but strain 36,502 was unknown geographical location.
Supplemental material