
Figures & data
Figure 1. Maternal and perinatal outcomes among pregnant women with and without SARS-CoV-2 infection.
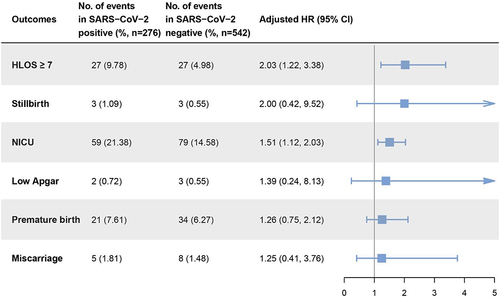
Figure 2. Comparison of blood routine test results upon admission for pregnant women, with or without SARS-CoV-2 infection, under different maternal and perinatal outcomes.
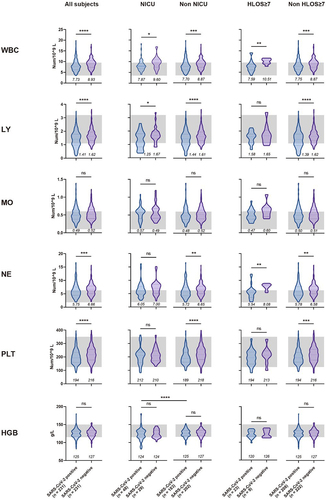
Figure 3. Comparison of coagulation test results upon admission for pregnant women, with or without SARS-CoV-2 infection, under different maternal and perinatal outcomes.
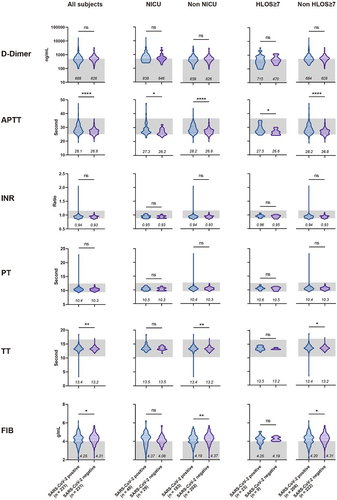
Figure 4. Comparison of metabolic test results upon admission for pregnant women, with or without SARS-CoV-2 infection, under different maternal and perinatal outcomes.
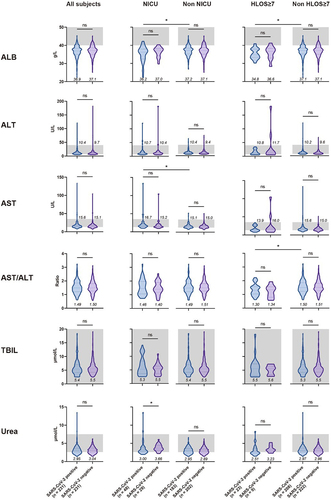
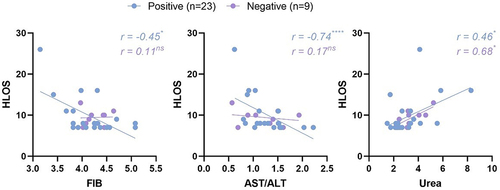
Figure 5. In women with an HLOS of seven days or more, some laboratory test indices showed correlations with HLOS.
Supplemental Material
Download MS Word (157.1 KB)Data availability statement
the Data generated during the study is available at repository “figshare” at https://figshare.com/articles/dataset/COVID-19_in_pregnant_women_original_data_csv/25764261 and lastly the reference number [10.6084/m9.figshare.25764261].