
Figures & data
Figure 1. NADH reverts the resistance of ATCC15947 to neomycin. (a) Dose-response matrix (inhibition) for NADH & neomycin. The inhibition ratio is positively relative to the degree of red. (b) The drug interaction landscapes based on the Bliss model on ATCC15947. The synergy score is showed by red (>0) and green (<0). (c) Calcusyn analysis of NADH combined with neomycin synergy on ATCC15947 (Combined R = 0.95, NADH R = 0.72, neomycin R = 0.94). (d) Time gradient sterilization experiment of 3 mM NADH and 30 μg/mL neomycin. (e) SEM of ATCC15947: (1) Control group, (2) NADH group of 3 mM, (3) Neomycin group of 30 μg/mL, (4) NADH combined with neomycin group. Data are presented as mean ± SEM (n = 3 biological replicates).
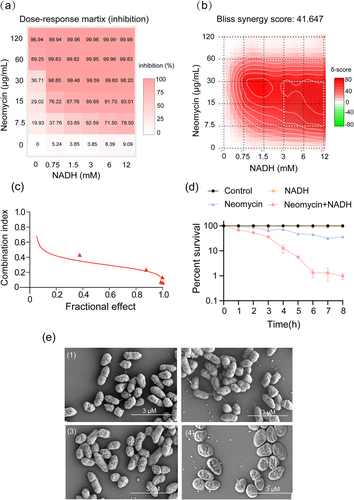
Figure 2. Metabolome analysis of ATCC15947 between control and NADH group. (a) Heat map showing differential abundance of metabolites. Blue and yellow colors indicate lower and higher abundances of the metabolites relative to the mean level of the control group, respectively. (b) Z-score plots of changes in differential metabolites based on control. The data were respectively scaled to the mean and standard deviation of control. Each point represents one biological repeat. Different treatments are distinguished by the color. (c) Categories of differential abundance of different metabolites. (d) Significantly enriched metabolic pathways in response to NADH treatment (p < 0.05). (e) Changes in differential metabolites involved in the significantly enriched pathways. Yellow colour and blue colour indicate increased and decreased metabolites, respectively.
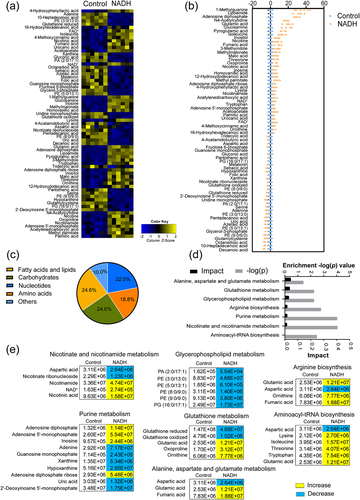
Figure 3. NADH promotes purine metabolism. (a) Changes in purine metabolism after addition of NADH in ATCC15947. (b) qRT-PCR for expression of genes in purine metabolism in the absence and presence of NADH. (c) Activity of NDK were detected with and without 3 mM NADH. (d)–(g) the concentration effect of adenine/ATP/ADP/AMP plus 30 μg/mL neomycin on the bactericidal efficacy. Data are presented as mean ± SEM (n = 3 biological replicates). *p < 0.05.**p < 0.01. ***p < 0.001.
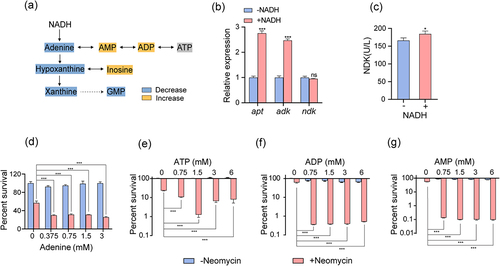
Figure 4. NADH promotes respiratory chain and ATP generation. (a) Effects of NADH on ATP content in ATCC15947. (b)–(d) the concentration effect of rotenone/NaN3/resveratrol on the bactericidal efficacy of 3 mM NADH combined with 30 μg/mL neomycin. Data are presented as mean ± SEM (n = 3 biological replicates). *p < 0.05.**p < 0.01. ***p < 0.001.
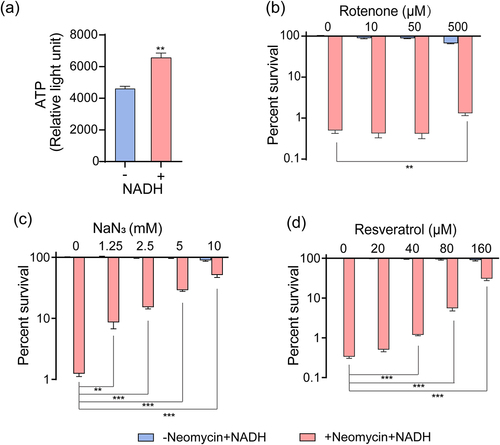
Figure 5. NADH increased PMF and intracellular neomycin content. (a) Changes in intercelluar pH with effect of neomycin or NADH in ATCC15947. (b) Membrane potential changes after treating with NADH. (c)–(d) the concentration effect of nigericin/(NH4)2SO4/CCCP on the bactericidal efficacy of 3 mM NADH combined with 30 μg/mL neomycin. (f) Intracellular neomycin content was detected in presence of NADH and neomycin. Data are presented as mean ± SEM (n = 3 biological replicates). *p < 0.05.**p < 0.01. ***p < 0.001.
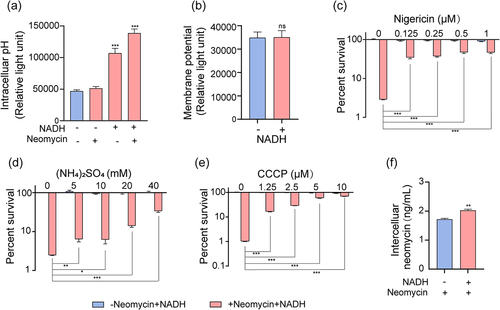
Figure 6. NADH sensitizes ATCC15947 to neomycin killing through inducing imbalance of oxidative – antioxidative system. (a) Changes in ROS levels with effect of neomycin or NADH in ATCC15947. (b) Activity of SOD were detected with and without 3 mM NADH. (c) and (d) NADH affected the ratio of NAD+/NADH and NADP+/NADPH. (e) The concentration effect of GSH on the bactericidal efficacy of 3 mM NADH combined with 30 μg/mL neomycin. Data are presented as mean ± SEM (n = 3 biological replicates). *p < 0.05.**p < 0.01. ***p < 0.001.
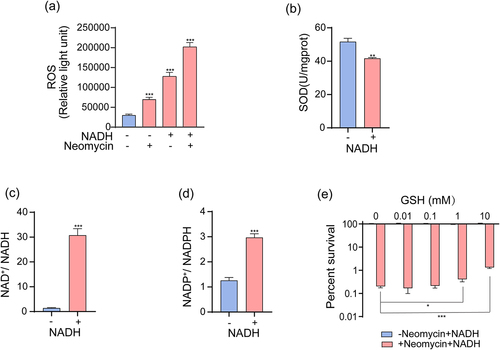
Figure 7. NADH can inhibit inactivation of aminoglycosides caused by AACs. (a) and (b) Synergistic bactericidal efficacy of different concentrations of gentamicin/amikacin with 3 mM NADH. (c) 3D schematic diagram of NADH binding to the active site of AACs. Data are presented as mean ± SEM (n = 3 biological replicates). *p < 0.05.**p < 0.01. ***p < 0.001.
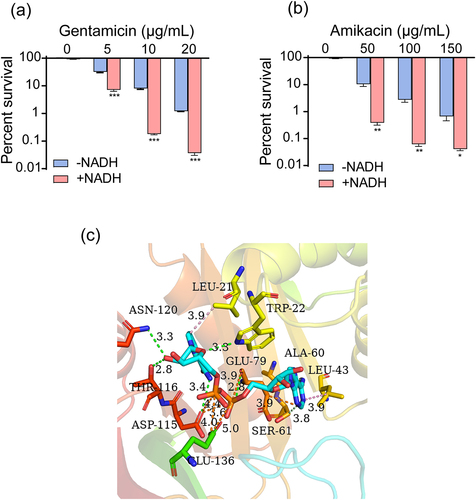
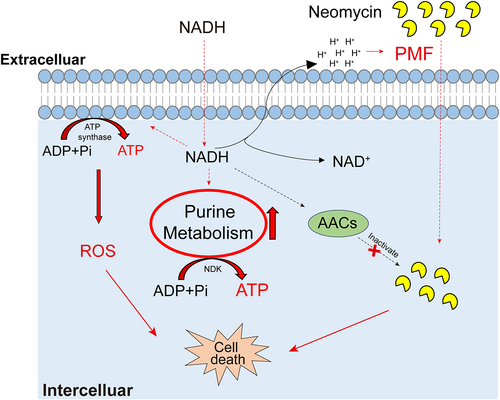
Figure 8. Proposed mechanism of NADH-promoted neomycin killing ATCC15947. Exogenous NADH promotes purine metabolism and cellular respiration, causing an increase in intracellular ATP as well as neomycin content and intracellular ROS level. Increased ATP level elevated neomycin bactericidal efficiency. NADH also inhibits the activity of AACs, which prevents neomycin from inactivation caused by AACs, allowing keep high concentration of neomycin in cells.
Supplemental Material
Download MS Word (959.9 KB)Data availability statement
The data generated during the study is available at repository name “Metabolomic data of ATCC15947” at https://doi.org/10.6084/m9.figshare.25484686