
Figures & data
Table 1. PCR primers used in this study.
Table 2. Synthetic sequences used in this study.
Figure 1. Nucleotide and predicted amino acid sequences of SinHIF-1α in Strongylocentrotus intermedius. The numbers on the left alternate from top to bottom as the nucleotide sequence and the deduced amino acid sequence numbers. The black font indicates the nucleotide sequence, and the red font indicates the amino acid sequence. The basic helix-loop-helix (bHLH) domain (residues 14–67) is shaded in green, the Per-ARNT-Sim (PAS) a (PAS-A) domain (residues 83–151) is shaded in blue, and the PAS-B domain (residues 252–303) is shaded in yellow. Blue italic font represents the initiation codon (ATG), the asterisk (*) represents the termination codon (TGA), and the polyadenylation signal (AATAA) is framed by a box.
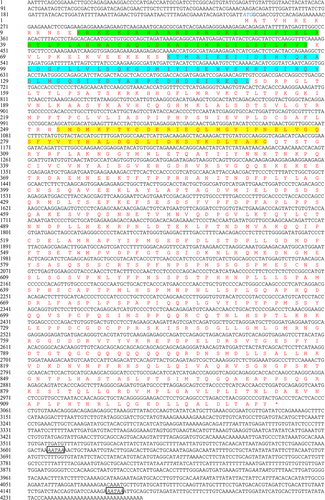
Figure 2. Sequence characteristic analysis of SinHIF-1α in Strongylocentrotus intermedius. (a) Transmembrane structure analysis of SinHIF-1α protein. (b) Hydrophobic or hydrophilic analysis of SinHIF-1α protein. (c) Predicted protein secondary structure (Pred) of the SinHIF-1α protein. Yellow, pink, and grey indicate strands, helices, and coils, respectively. (d) Predicted 3D structure of the SinHIF-1α protein and HIF-1α proteins from six other species. The predicted 3D structure of Mus musculus HIF-1α protein (MmHIF-1α; Swiss-model No.: 4zpr.1.B) was used as a template. XtHIF-1α, DrHIF-1α, SpaHIF-1α, MyHIF-1α, AjHIF-1α, and SpuHIF-1α represent HIF-1α proteins from Xenopus tropicalis, Danio rerio, Scylla paramamosain, Mizuhopecten yessoensis, Apostichopus japonicus, and Strongylocentrotus purpuratus, respectively.
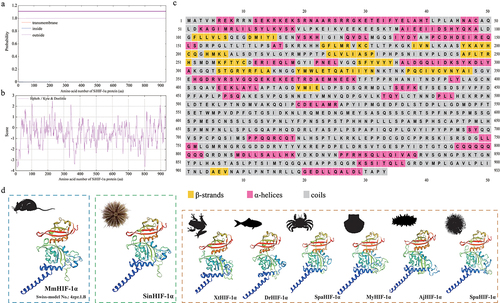
Figure 3. Phylogenetic analysis of SinHIF-1α in Strongylocentrotus intermedius. (a) Multiple sequence alignment of HIF-1α proteins from S. intermedius and 28 other species. The bHLH domain is framed by a green box, while the PAS-A and PAS-B domains are framed by a red box and a blue box, respectively. (b) Schematic diagram of the conserved structural domain of HIF-1α homologs from S. intermedius and eight other species. (c) Neighbor-joining phylogenetic tree of HIF-1α family homologs from S. intermedius and 39 other species. SinHIF-1α is marked with a “◄” symbol. The numbers at the tree nodes indicate bootstrap support values based on 1,000 replicates..
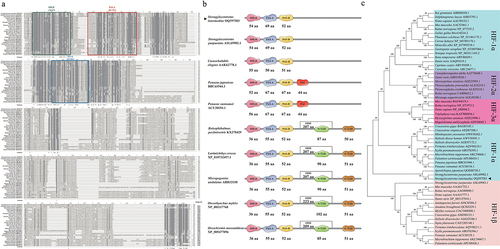
Figure 4. Spatial expression pattern, binding site identification, and verification of miR-2013-3p and SinHIF-1α and their effects on ATP content in coelomocytes of Strongylocentrotus intermedius. (a) Spatial expression pattern of miR-2013-3p and SinHIF-1α mRNA. (b) Spatial expression pattern of SinHIF-1α protein. PM: perioral membrane; IM: interdental muscle; CL: coelomocytes; GN: gonad. Different lower-case letters (e.g. a or a’) represent differing significance levels between different tissues (P< 0.05). ** represents an extremely significant difference between miR-2013-3p and SinHIF-1α mRNA in the same tissue (P < 0.01). (c) Schematic representation of the putative miR-2013-3p targeting site in SinHIF-1α mRNA and the analysis of relative luciferase activities. (d) &; (e) Validation of the interaction relationship of miR-2013-3p and SinHIF-1α in vivo. (f) Effects of miR-2013-3p and SinHIF-1α on ATP content in coelomocytes of S. intermedius. NC-RNAi: negative control of SinHIF-1α silencing (RNAi) group: NC: negative control of miR-2013-3p overexpression (agomir) group; NC-inhibitor: negative control of miR-2013-3p inhibition (antagomir) group. ** represents P < 0.01; n = 3.
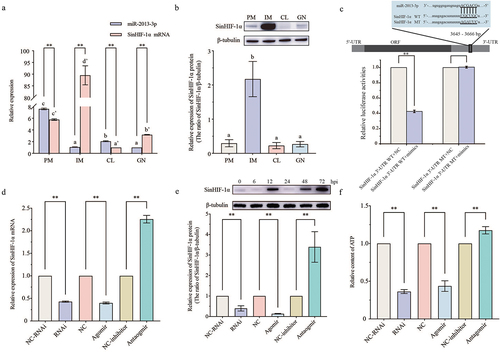
Figure 5. Effects of SinHIF-1α and miR-2013-3p on mRNA expression and enzyme activity of SinGDH in coelomocytes of Strongylocentrotus intermedius. (a) and (b) Effects of SinHIF-1α and miR-2013-3p on SinGDH mRNA and protein expression. (c) Effects of SinHIF-1α and miR-2013-3p on total SinGDH enzyme activity. NC-RNAi: negative control of SinHIF-1α silencing (RNAi) group: NC: negative control of miR-2013-3p overexpression (agomir) group; NC-inhibitor: negative control of miR-2013-3p inhibition (antagomir) group. * represents P < 0.05; ** represents P < 0.01; n = 3.
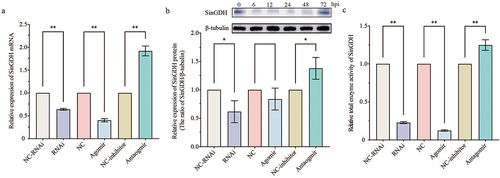
Figure 6. Pathogen infection altered the relative expression of miR-2013-3p, SinHIF-1α (mRNA and protein), and SinGDH (mRNA and protein) and induced changes in total SinGDH enzyme activity and ATP content in coelomocytes of Strongylocentrotus intermedius. (a) Relative alteration of the expression of miR-2013-3p and SinHIF-1α mRNA in coelomocytes of S. intermedius after pathogen infection. (b) Relative alteration of the expression of SinHIF-1α protein after pathogen infection. (c) Changes in ATP content in coelomocytes of S. intermedius after pathogen infection. (d) &; (e) Relative alteration of the expression of SinGDH mRNA and protein in coelomocytes of S. intermedius after pathogen infection. (f) Total changes in SinGDH enzyme activity in coelomocytes of S. intermedius after pathogen infection. Different lower-case letters (e.g. a) represent differing significance levels between different groups (P < 0.05). ** represents an extremely significant difference compared with 0 hpi (P < 0.01); * represents a significant difference compared with 0 hpi (P < 0.05); n = 3.
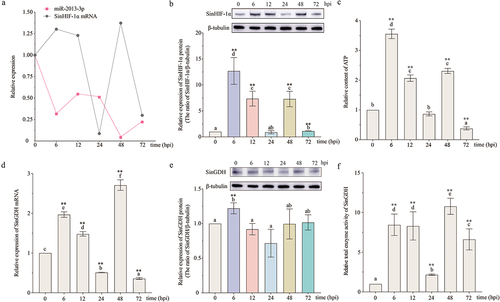
Figure 7. Effects of changes in miR-2013-3p expression and SinHIF-1α silencing on SinHIF-1α and SinGDH (mRNA and protein) expression, ATP content, and total SinGDH enzyme activity in coelomocytes of Strongylocentrotus intermedius after pathogen infection. (a) &; (b) Effects of miR-2013-3p expression changes and SinHIF-1α silencing on SinHIF-1α (mRNA and protein) expression patterns in coelomocytes of S. intermedius after pathogen infection. (c) Effects of miR-2013-3p expression changes and SinHIF-1α silencing on the ATP content in coelomocytes of S. intermedius after pathogen infection. (d) &; (e) Effects of miR-2013-3p expression changes and SinHIF-1α silencing on SinGDH (mRNA and protein) expression patterns in coelomocytes of S. intermedius after pathogen infection. (f) Effects of miR-2013-3p expression changes and SinHIF-1α silencing on total SinGDH enzyme activity after in coelomocytes of S. intermedius after pathogen infection. NC-RNAi: negative control of SinHIF-1α silencing (RNAi) group; NC: negative control of miR-2013-3p overexpression (agomir) group; NC-inhibitor: negative control of miR-2013-3p inhibition (antagomir) group. Different lower-case letters (e.g. a, a’, or A) represent differing significance levels between different groups (P < 0.05). * represents P < 0.05; ** represents P < 0.01; n = 3.
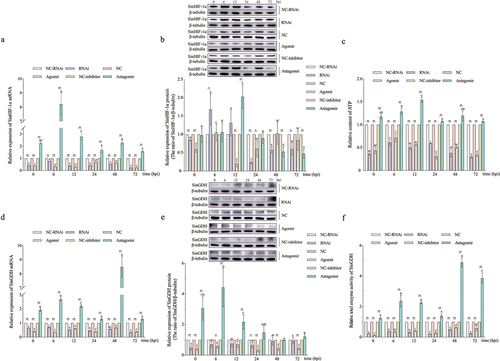
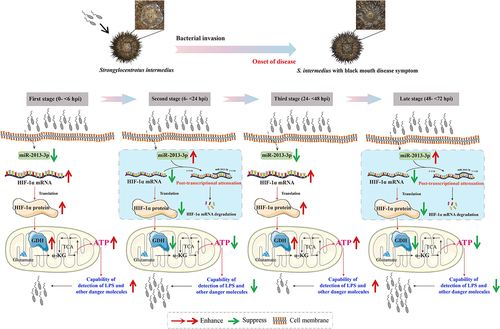
Figure 8. Schematic diagrams of miR-2013-3p and SinHIF-1α involved in host-pathogen interaction of Strongylocentrotus intermedius. α-KG: alpha-ketoglutarate; TCA: tricarboxylic acid cycle; LPS: lipopolysaccharide.
Supplemental Material
Download MS Word (485.8 KB)Data availability statement
Data openly available in a public repository. The data that support the findings of this study are openly available in GenBank accession No. OQ397583 (https://www.ncbi.nlm.nih.gov/nuccore/OQ397583) and Figshare accession No. 10.6084/m9.figshare.25896994 (https://figshare.com/articles/dataset/The_raw_data/25896994).