
Figures & data
Figure 1. Mildly and efficiently labelling viruses with QDs. (a) TEM images of SFV, JEV and IAV particles. (b) Infectious titers of viruses and QD-labeled viruses. (c) Fluorescence images of viruses labeled by QD 705 and stained with Syto 82 nucleic acid dye. (d) Line profiles showing distributions of the QD and Syto signals on the lines in C. (e) The efficiencies of QDs labelling the Syto-stained viruses.
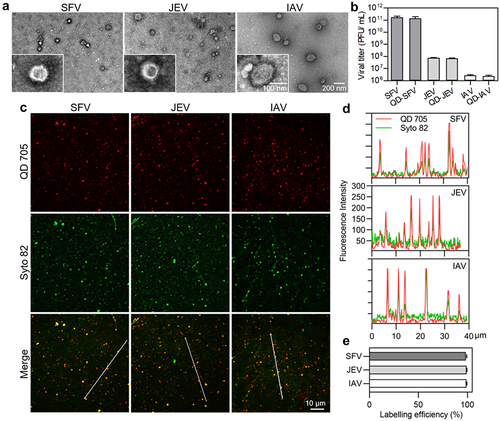
Table 1. The infectivity of SFV, JEV and IAV (n = 3).
Figure 2. Quantitatively analyzing the efficiency of virus attachment to cells. (a) Flow chart for quantitative analysis of virus attachment. (b) SFV, JEV and IAV particles were incubated with cells at 4°C for 0, 10, 20, 30, 40, 50 and 60 min. After fixation, the cells were imaged in 3D and the number of viruses attached to the cell surface were counted with ImageJ (n = 50). (c) Different amounts of virus particles were added to cells, allowed to be attached to cells, labeled with QDs, and then imaged in 3D. The panels are the z-projection images of cells attached with SFV, JEV and IAV, respectively. (d) Different amounts of viruses were added to cells. The cells were imaged in 3D and the number of viruses attached to cells was quantified (n = 50). (e) The efficiencies of virus attachment to cells (n = 50). In b, d and e, the right panels are the enlarged views of the shadow region of the left panels.
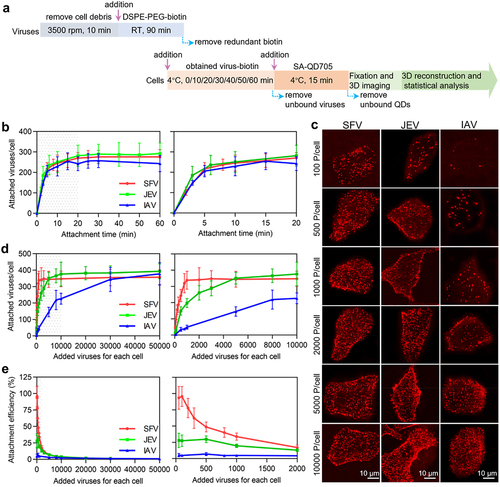
Figure 3. Quantitatively analyzing the efficiency of virus entry. (a) Flow chart for quantitative analysis of virus entry. (b) SFV, JEV and IAV were allowed to infect cells for 10, 20, 30, 40, 50 and 60 min. Then the cells were imaged in 3D and the number of viruses inside the cells was determined with ImageJ (n = 50). (c) Different amounts of viruses were allowed to bind to cells, labeled with QD705 (red), and allowed to infect cells for 30 min. The viruses remained on the cell surface were then stained with Cy3 (green). After that, the cells were imaged in 3D. The panels were the z-projection images of the cells. The red spots were intracellular viruses and the yellow were extracellular viruses. (d) Different amounts of viruses were allowed to be attached to cells. And the number of viruses entering cells after infection for 30 min was counted (n = 50). (e) The entry efficiencies of viruses (n = 50).
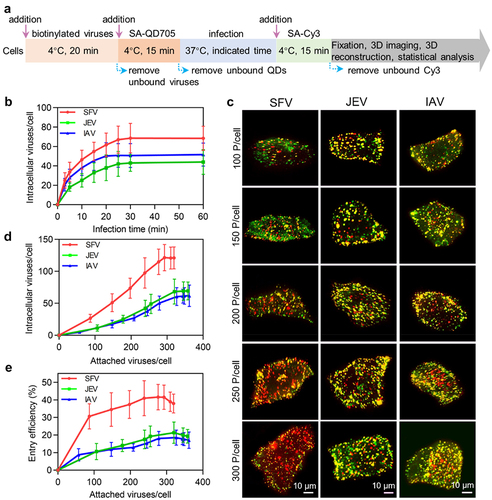
Figure 4. Quantitatively analyzing the efficiency of virus transport toward the cell interior. (a and b) trajectories of QD705-labeled viruses (red) moving in cells with GFP-labeled microtubules (gray). The white circles in a indicate the MTOC of the cells. (c) The speed vs time plots of the trajectories. (d) Displacements of viruses moving along microtubules toward the MTOC (n = 50). (e) The proportions of viruses moving along microtubules toward the MTOC.
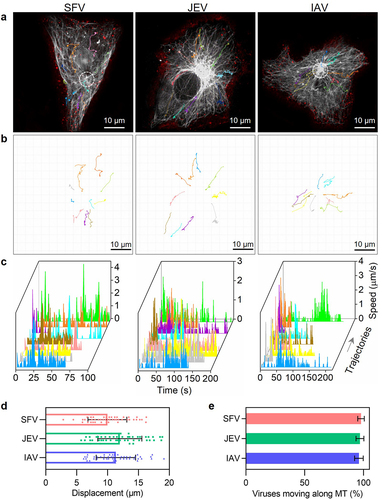
Figure 5. Quantitatively analyzing the efficiency of virus membrane fusion. (a) Flow chart for quantitative analysis of virus membrane fusion. (b) DiO-R18-labeled viruses were allowed to infect cells for different time periods. (c) DiO fluorescence intensity-to-R18 fluorescence intensity ratios in cells infected by DiO-R18-labeled viruses measured by flow cytometry (n = 3). (d) The membrane fusion efficiencies of viruses in cells infected by DiO-R18-labeled viruses (n = 30). (e) The efficiencies of the viruses’ different invasion stages when the viruses infect cells at low concentration.
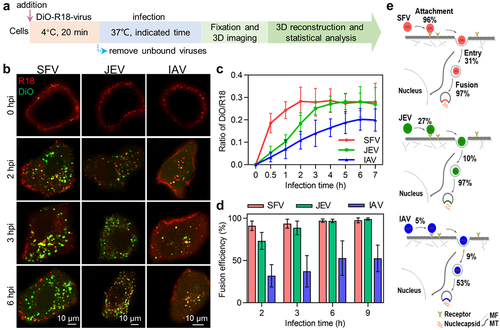
Table 2. The infectivity of SFV, ultrafiltered SFV (UF SFV) and ultracentrifuged SFV (UC SFV); JEV, ultrafiltered JEV (UF JEV) and ultracentrifuged JEV (UC JEV); IAV, ultrafiltered IAV (UF IAV) and ultracentrifuged JEV (UC IAV) (n = 3).
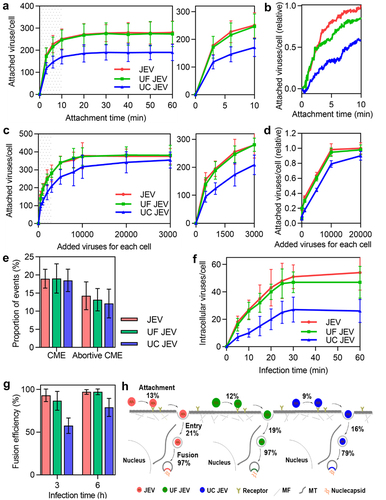
Figure 6. Quantitatively analyzing the effect of ultracentrifugation and ultrafiltration purification on virus invasion. (a) JEV, UF JEV and UC JEV particles were incubated with cells at 4°C for 0, 3, 6, 10, 20, 30, 40, 50 and 60 min. Then the cells were imaged in 3D and the number of viruses attached to the cell surface was determined with ImageJ (n = 50). (b) R18-labeled viruses were incubated with cells at 37°C. Its adsorption to cells in the first 10 min was monitored in real-time. (c and d) Different amounts of viruses were incubated with cells. The viruses attached to cells were quantified from 3D images (n = 50) (c) or by flow cytometry (d). (e) The proportions of viruses entering cells via CME and the proportions of viruses recruiting clathrin but failing to enter cell (n = 50). (f) JEV, UF JEV and UC JEV were allowed to infect cells for 5, 10, 15, 20, 25, 30 and 60 min. Then the cells were imaged in 3D and the number of viruses inside the cells was determined with ImageJ (n = 50). (g) The membrane fusion efficiencies of viruses in cells infected by DiO-R18-labeled viruses (n = 50). (h) The efficiencies of the viruses’ different invasion stages when 2000 virus particles per cell were allowed to infect cells.
Supplemental Material
Download MS Word (658.4 KB)Data availability statement
The data supporting the findings of this study are openly available in the Science Data Bank at https://doi.org/10.57760/sciencedb.15988