
Figures & data
Figure 1. Pathogenic effect of H. pylori CagAE and CagAW mediated by SHIP2 in AGS cells.
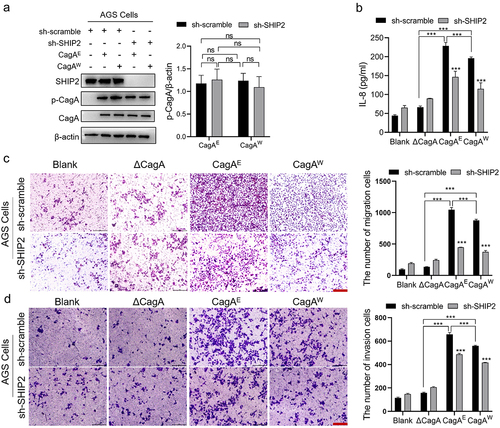
Figure 2. The effect of H. pylori infection on the sub-localization of SHIP2, production of PI(3,4)P2 and activation of Akt signaling.
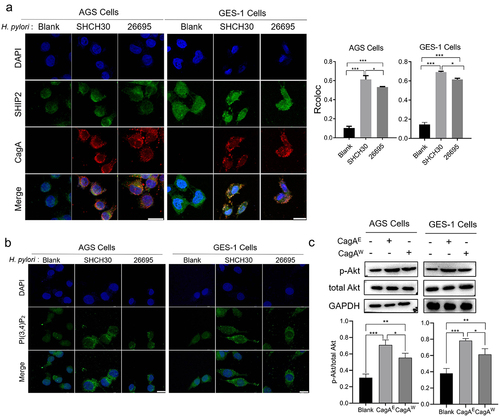
Figure 3. Detection of the interaction difference between CagAE or CagAW with SHIP2.
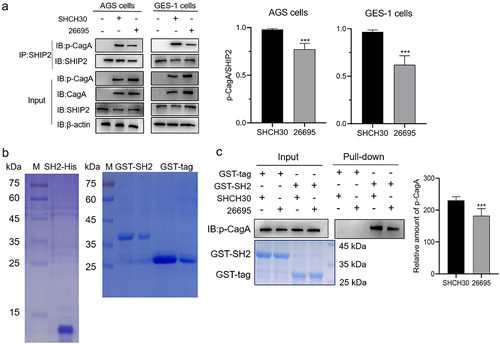
Figure 4. Surface plasmon resonance (SPR) analysis of the interactions between SHIP2-SH2 domain with EPIpYA-D or EPIpYA-C peptides. Recombinant His tagged SHIP2-SH2 (Figure3(b)) was immobilized on a BIAcore CM5 sensor chip as the receptor. EPIpYA-C (a) or EPIpYA-D (b) at different concentrations flow through the chip. Sensorgrams were recorded by a BIAcore T100 instrument. For each peptide interaction, the response values at a fixed time point for different concentrations of peptides are marked and fitted into a stoichiometric reaction curve (c for EPIpYA-c and d for EPIpYA-D). The values of KD were then calculated according to the curves with Biacore T100 Evaluation Software.
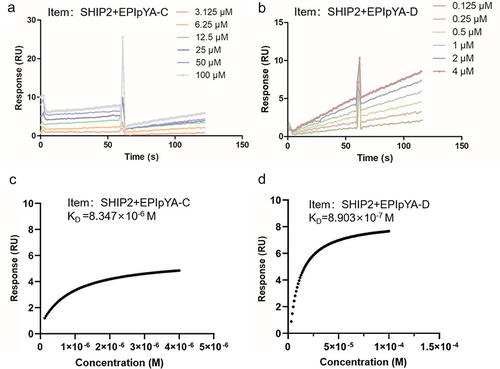
Figure 5. Comparative analysis of the interaction of SHIP2-SH2 domain with EPIpYA-C and EPIpYA-D peptides. (a) The binding energies of two peptides with SHIP2-SH2 domain were calculated with two algorithms, MMGBSA and MMPBSA. (b) Superimposition of SHIP2-SH2 domain interacting with EPIpYA-C and EPIpYA-D motifs. (c) Overall structure of the SHIP2-SH2-EPIpYA-C complex in two views. (d) Overall structure of the SHIP2-SH2-EPIpYA-D complex in two views. Cyan and light gray indicate EPIpYA-C and EPIpYA-D peptides respectively where their Tyr residues were both phosphorylated. Green and dark gray indicate SH2 domains interacting with EPIpYA-C and EPIpYA-D peptides respectively.
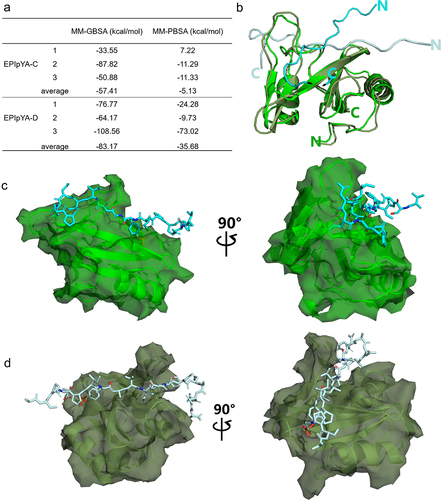
Figure 6. Key sites analysis in complexes of SHIP2-SH2-EPIpYA-C and SHIP2-SH2-EPIpYA-D. (a) Complex of SHIP2-SH2-EPIpYA-C. (b) Details of interaction surface of SHIP2-SH2-EPIpYA-C complex. (c) Complex of SHIP2-SH2-EPIpYA-D. (d) Details of interaction surface of SHIP2-SH2-EPIpYA-D. pY-115 indicates the phosphorylated tyrosine residue in synthesized peptides. Other residues on peptides are marked in black. The amino acids in green represent residues on SHIP2-SH2 domain those interact with EPIpYA-C motif, and in dark grey represent residues on SHIP2-SH2 domain those interact with EPIpYA-D peptide.
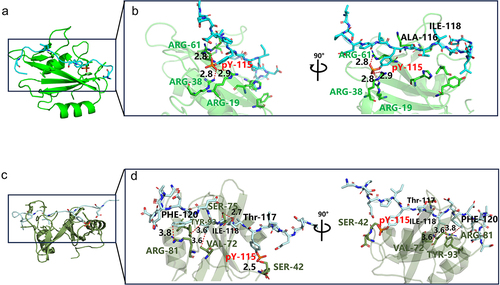
Figure 7. Confirmation of key role of Phe-120 in the interaction between EPIpYA-D and SHIP2-SH2. (a) Sequences of EPIpYA-D and its mutant peptides. (b–d) Stoichiometric reaction curves of SHIP2-SH2 interacting with EPIpYA-D or its mutant peptides from SPR analysis.
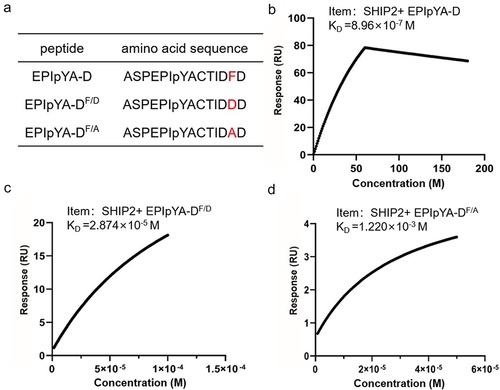
Figure 8. Verification of role of residue Phe in CagAE-SHIP2 interaction by cell infection assays. (a) Immunoprecipitation analysis of CagAE and its mutants (CagAF/D and CagAF/A) with SHIP2 in infected cells. Antibody against CagA was used as IP antibody, antibody against SHIP2 was used to reveal the amount of SHIP2 interacted with CagA. (b) Western blotting indicating activation of Akt pathway in infected cells. (c) Western blotting detecting the phosphorylation level of p-65 to indicate the activation of NF-κB pathway in infected cells. (d) Secretion of IL-8 by infected cells. Error bars represent means ± SD, **indicates p < 0.01, ***indicates p < 0.001. The other notes represent the same meaning as above.
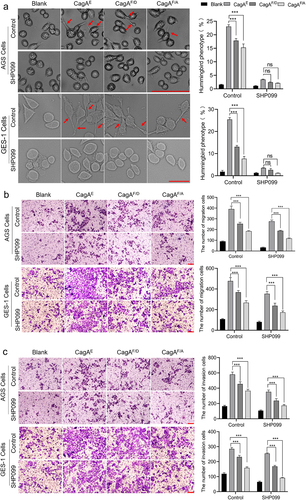
Figure 9. Role of residue Phe in EPIYA-D motif in affecting the oncogenicity of CagAE. SHP099 was used as an inhibitor to exclude the effect of interaction between SHP2 and CagA, as Phe in EPIYA-D motif was also reported to play roles in SHP2-CagAE interaction to improve the cytotoxicity of CagAE. (a) Examination of CagA induced specific hummingbird phenotype. Elongated cells with the longest axis exceeding the shortest axis by more than 2-fold were counted as the hummingbird phenotype. (b) Migration and (c) invasion of infected AGS and GES-1 cells examined by transwell assays. Bars in images represent 100 µm. Left, representative images; Right, statistical data. Error bars represent means ± SD, ns indicates no statistical significance, ***indicates p < 0.001.
EPIYA C peptide percentage.jpg
Download JPEG Image (1.7 MB)
EPIYA C peptide MS confirmation.jpg
Download JPEG Image (614.4 KB)
EPIYA D peptide MS confirmation.jpg
Download JPEG Image (1.5 MB)
Supplemental Material.docx
Download MS Word (1 MB)EPIYA D percentage.jpg
Download JPEG Image (1.8 MB)
Data Availability statement
The data generated during the study is available at figshare database at https://figshare.com doi.org/[10.6084/m9.figshare.25356829].