Figures & data
Figure 1. Location of the Tana River basin, reservoirs and land use.
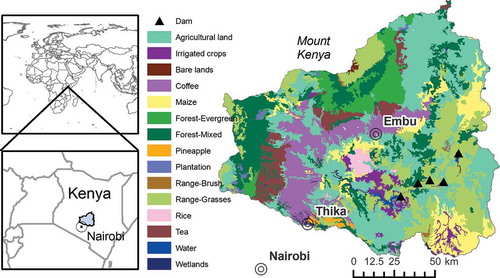
Figure 2. Spatial expression of predicted erosion reduction, as compared with the baseline scenario, following ridging.
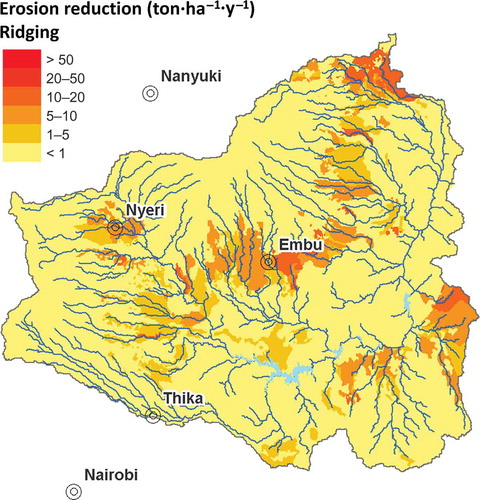
Figure 3. Spatial expression of the increase of recharge, as compared with the baseline scenario, following mulching.
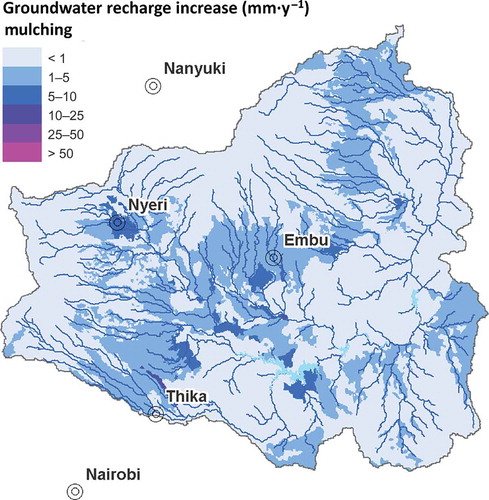
Table 1. Modelled effects – percentages relative to the baseline – of different soil and water conservation scenarios on indicators related to green water, blue water and erosion. Values were calculated for relatively dry and wet years and cover different crops, as indicated (see text).
Table 2. Benefit-cost analysis from the introduction of GWC scenarios based on the combined use of SWAT and WEAP analysis tools.
Figure 4. Total revenues (benefits minus costs) of implementation of the GWC scenarios for the four dominant water sectors (hydropower, domestic water supply and irrigated and rainfed agriculture).
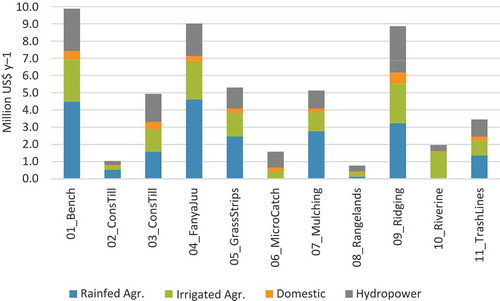
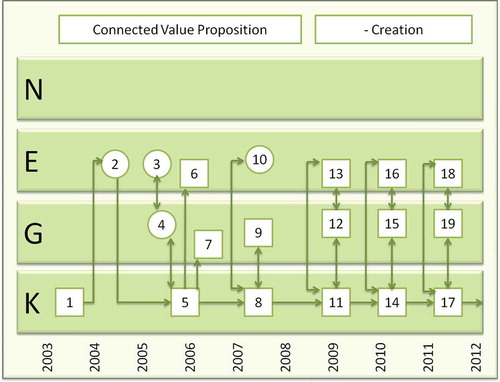
Figure 5. Timeline illustrating developments after proposing and implementing a GWC approach in the Tana River basin, Kenya. K = knowledge community, G = governmental at different levels, E = enterprises and business, N = NGOs (for box numbers, see text).