Figures & data
Figure 1. Schematic representation of one sampling site, showing the distribution of the vegetation sampling grids and litter traps within the hybrid poplar plantation and natural uncut forest stand (top), and the soil profile created by the ‘V-blade’ site preparation treatment (bottom). The figure is not to scale. For ease of reading, all sampling plots are not included in the figure. Refer to Section 2 for the actual number of sampling grids and litter traps.
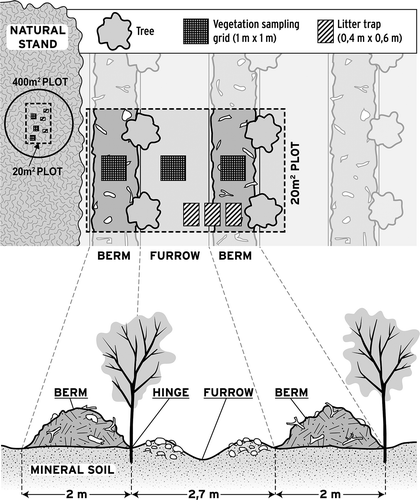
Table 1. Characteristics of the uncut natural stands paired with each plantation site.
Table 2. Species encountered during the vegetation surveys with their corresponding codes.
Table 3. Functional plant trait description and codification used for statistical analyses.
Table 4. Mean (SD) hybrid poplar dimensions in plantations of various ages.
Table 5. Mean (SD) species richness and percent cover of the shrub and tree layers in natural stands and hybrid poplar plantations of various ages.
Figure 2. Principal response curves (PRC) through time for species composition in furrows and berms compared to natural forest stands. Presented are (a) the canonical coefficient for the berm and furrow samples in the 4, 8, and 12-year-old hybrid poplar plantations and (b) the scores for all taxa. In (b), scores indicate how strongly each species is associated with the natural forest (larger positive values) or plantations (larger negative values). In (b), species position along the horizontal axis (left to right) is for clarity only. See for species codes.
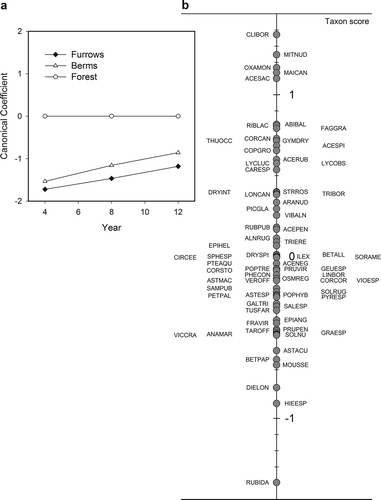
Figure 3. Principal response curves (PRC) through time for trait composition in the furrows and the berms compared to natural forest stands. Presented are (a) the canonical coefficient for the berm and furrow locations in the 4, 8, and 12-year-old hybrid poplar plantations and (b) the scores for all traits. In (b), scores indicate how strongly each trait is associated with the natural forest (larger positive values) or plantations (larger negative values). LIG: light requirement; MDR: minimum root depth; PGR: growth rate; REP: main reproduction mechanism; SDO: seed dormancy; SFO: foliage structure; SPE: seed persistence; XER: water preference. See for detailed variable descriptions.
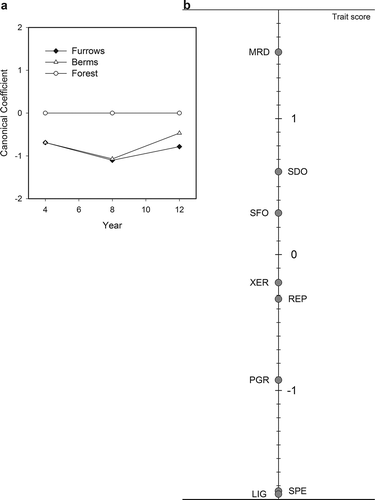
Table 6. Mean (SD) values for soil parameters in natural stands and hybrid poplar plantations at 4, 8, and 12 years at the berm and furrow positions.
Figure 4. Co-inertia analysis comparing the degree of association between matrices of species and soil variables for different berm (B) and furrow (F) plots within the 4, 8, and 12-year-old hybrid poplar plantations and referenced natural forest stands (Forest). Numbers indicate plantation age. Shorter arrows indicate stronger association between the matrices for a given plot. Consistency in arrow direction for a given treatment (e.g., furrows for the year 8 plantation or F8) would indicate an ecological pattern or environmental gradient (as in principal component analyses).

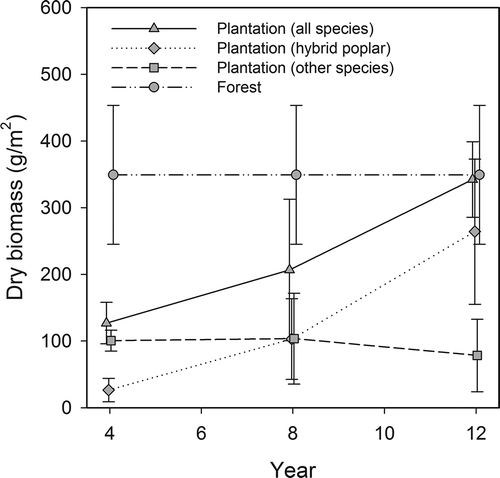
Figure 5. Litterfall collected between 24 September and 25 November 2012 for the 4, 8, and 12-year-old hybrid poplar plantations and associated natural forest stands. Data are presented as mean ± standard deviation.