Figures & data
Figure 1. Government stringency index: the case of Switzerland. Note: The Stringency index is a composed measure based on nine response indicators including school closures, workplace closures and travel bans, rescaled to a value range 0–100 (100 = strictest) | Source: Hale et al., (Citation2021).
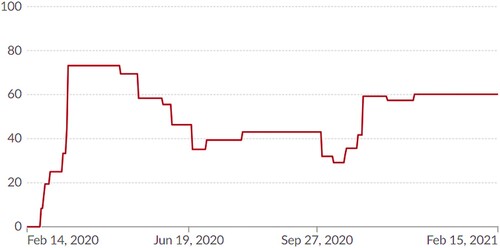
Table 1. Descriptive statistics (Ntotal = 5843).
Figure 2. Fixed-effects regression: trust development from 2008 until 2021 with 95% confidence intervals. Note: The results from the extra COVID-19 survey is highlighted. A numerical table of the results can be found in the appendix of the article. The fourth sample, added in 2020, is not included here.
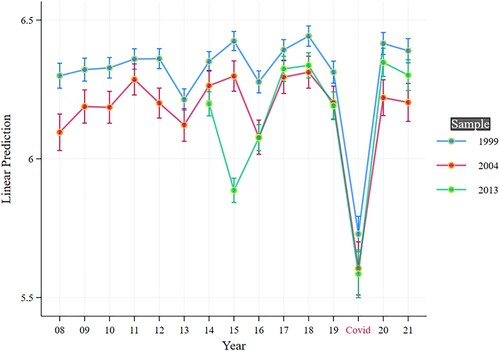
Figure 3. First difference regression: within-individual factors of change in trust between t1 and t2. Note: change between the annual 2019 wave and the extra COVID-19 wave, i.e. the ‘decrease’ in social trust. A numerical table of the results can be found in the appendix.
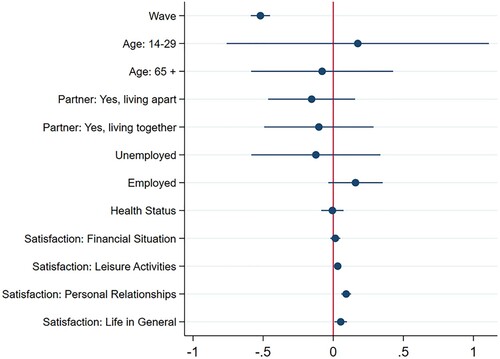
Figure 4. First difference regression: within-individual factors of change in trust between t2 and t3. Note: Change beetween the extra COVID-19 wave and the annual 2020 wave, i.e. the ‘increase’ in social trust. A numerical table of the results can be found in the appendix.
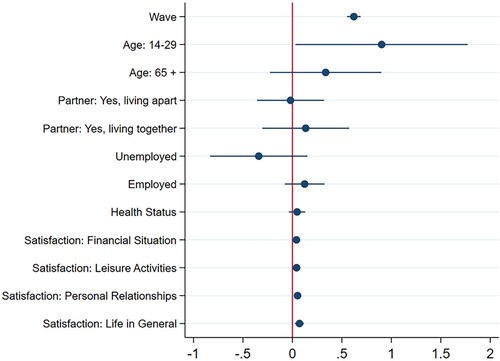
Figure 5. Multinominal logistic regression: confidence intervals of 95% (Nvalid = 4049). Note: Reference for the restriction variable=‘people who don’t think the restrictions are problematic at all and necessary’ | Reference for the partner variables= ‘people who share a household with their partner’ | Reference for the female variable= ‘male’ | reference for the age groups= ‘14–25’ | Reference for the employment status variable= ‘employed’ | Log likelihood −2330.7528 (iteration 4) | Prob chi2 0.00000 | Lr chi2(42) 11.98 | Pseudo R2 0.0235 | A numerical presentation of the multinominal logistic regression is included in the appendix.
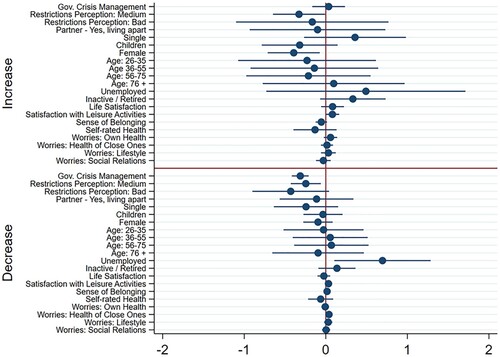
Table A1. First differences regression – within-individual factors for the ‘drop’ in trust between t1 and t2.
Table A2. First differences regression – within-individual factors for the ‘rise’ in trust between t2 and t3.
Table A3. Patterns of meaningful change in social trust (Ntotal = 5843).
Table A4. Multinominal logistic regression analysis: summer of 2020 data (Nvalid = 4049).
Figure A1. Wave-to-wave challenge-generating the ‘measningful change’ variable. Note: 2018 = Reference datapoint |1 = 2019; 2 = the extra COVID-19 wave; 3 = 2020.
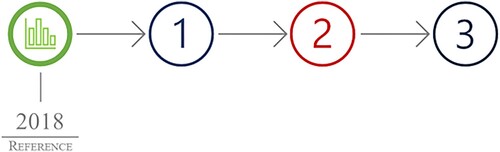
Table A5. Fixed-effects regression analysis – trust development from 2008 to 2021.
Table A6. Descriptive statistics: correlations matrix.
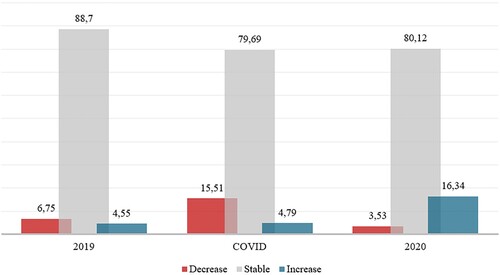
Figure A2. Wave-to-Wave Change in Social Trust of at least 1 Standard Deviation (%). Note: Nvalid in 2019 = 8732| COVID = 5669| 2020 = 15534.