2,137
Views
24
CrossRef citations to date
0
Altmetric
Brief Report

Cdc42 regulates Cdc42EP3 function in cancer-associated fibroblasts

&
Pages 49-57 | Received 23 Mar 2016, Accepted 23 May 2016, Published online: 26 Sep 2016

Figures & data

Figure 1. Cytoskeletal networks in normal mammary fibroblasts (NFs) and MMTV-PyMT derived breast CAFs (CAFs). (A) Left panels show images of F-actin (magenta), pS19-MLC2 (green) and DAPI (blue). Middle panels show F-actin (magenta), paxillin (green) and DAPI (blue) staining. Right panels show F-actin (magenta), αSMA (green) and DAPI (blue) staining. Scale bars represent 20 μm. (B) Left panels show images of F-actin (magenta), vimentin (green) and DAPI (blue). Right panels show F-actin (magenta), acetylated tubulin (green) and DAPI (blue) staining. Scale bars represent 20 μm. (C) Images show SEPT2 (green), SEPT7 (magenta) and DAPI (blue) staining. A zoom up area is shown for CAFs. Scale bars represent 20 μm. (D) Images show staining of F-actin (magenta), SEPT2 (green) and DAPI (blue) in CAFs. A zoom up area for F-actin and SEPT2 is shown. Scale bar represents 20 μm.
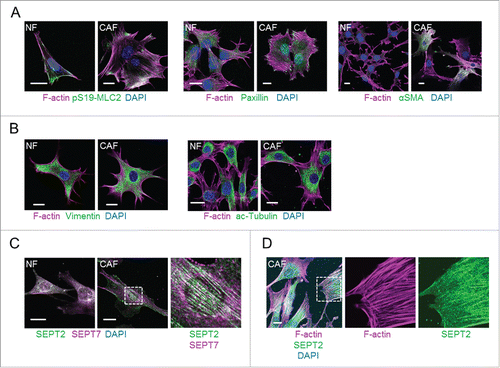
Figure 1. Cytoskeletal networks in normal mammary fibroblasts (NFs) and MMTV-PyMT derived breast CAFs (CAFs). (A) Left panels show images of F-actin (magenta), pS19-MLC2 (green) and DAPI (blue). Middle panels show F-actin (magenta), paxillin (green) and DAPI (blue) staining. Right panels show F-actin (magenta), αSMA (green) and DAPI (blue) staining. Scale bars represent 20 μm. (B) Left panels show images of F-actin (magenta), vimentin (green) and DAPI (blue). Right panels show F-actin (magenta), acetylated tubulin (green) and DAPI (blue) staining. Scale bars represent 20 μm. (C) Images show SEPT2 (green), SEPT7 (magenta) and DAPI (blue) staining. A zoom up area is shown for CAFs. Scale bars represent 20 μm. (D) Images show staining of F-actin (magenta), SEPT2 (green) and DAPI (blue) in CAFs. A zoom up area for F-actin and SEPT2 is shown. Scale bar represents 20 μm.

Figure 2. A Cdc42-defective binding mutant of Cdc42EP3 presents a diffuse pattern of cytosolic localization and does not induce actin and septin rearrangements in normal fibroblasts. (A) Panels show GFP (green), F-actin (magenta) and DAPI (blue) staining of normal fibroblasts following transfection with GFP or GFP-tagged wild-type (wt) or IS mutant (IS) Cdc42EP3 (CEP3) proteins. The grayscale panels show individual channels for F-actin and GFP. Scale bars, 25 μm. (B) Panels show GFP (green), SEPT2 (magenta) and DAPI (blue) staining of normal fibroblasts following transfection with GFP or GFP-tagged wild-type (wt) or IS mutant (IS) Cdc42EP3 (CEP3) proteins. The grayscale panels show individual channels for F-actin and GFP. Scale bars, 25 μm.
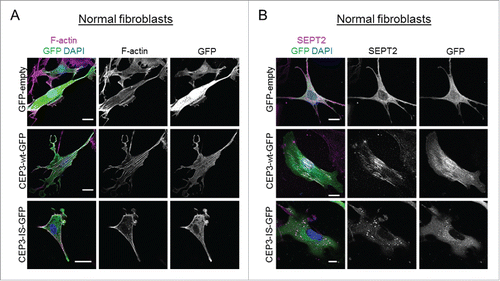
Figure 2. A Cdc42-defective binding mutant of Cdc42EP3 presents a diffuse pattern of cytosolic localization and does not induce actin and septin rearrangements in normal fibroblasts. (A) Panels show GFP (green), F-actin (magenta) and DAPI (blue) staining of normal fibroblasts following transfection with GFP or GFP-tagged wild-type (wt) or IS mutant (IS) Cdc42EP3 (CEP3) proteins. The grayscale panels show individual channels for F-actin and GFP. Scale bars, 25 μm. (B) Panels show GFP (green), SEPT2 (magenta) and DAPI (blue) staining of normal fibroblasts following transfection with GFP or GFP-tagged wild-type (wt) or IS mutant (IS) Cdc42EP3 (CEP3) proteins. The grayscale panels show individual channels for F-actin and GFP. Scale bars, 25 μm.

Figure 3. A Cdc42-defective binding mutant of Cdc42EP3 acts as a dominant-negative when expressed in cancer-associated fibroblasts (CAFs). (A) Panels show GFP (green), F-actin (magenta) and DAPI (blue) staining of cancer-associated fibroblasts (CAFs) following transfection with GFP or GFP-tagged wild-type (wt) or IS mutant (IS) Cdc42EP3 (CEP3) proteins. The grayscale panels show individual channel magnifications of perinuclear areas. Scale bars, 25 μm. (B) Panels show GFP (green), SEPT2 (magenta) and DAPI (blue) staining of CAFs following transfection with GFP or GFP-tagged wild-type (wt) or IS mutant (IS) Cdc42EP3 (CEP3) proteins. The grayscale panels show individual channel magnifications of perinuclear areas. Scale bars, 25 μm. (C) Left panels show images of GFP (green), pS19-MLC2 (magenta) and DAPI (blue) staining of CAFs following transfection with GFP or GFP-tagged wild-type (wt) or IS mutant (IS) Cdc42EP3 (CEP3) proteins. Right panels show GFP (green), pY118-Paxillin (magenta) and DAPI (blue) staining of CAFs following transfection with GFP or GFP-tagged wild-type (wt) or IS mutant (IS) Cdc42EP3 (CEP3) proteins. Scale bars represent 25 μm.
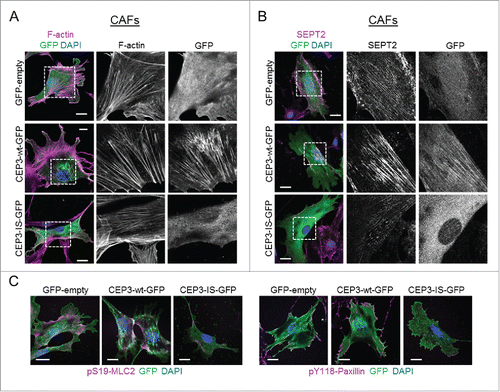
Figure 3. A Cdc42-defective binding mutant of Cdc42EP3 acts as a dominant-negative when expressed in cancer-associated fibroblasts (CAFs). (A) Panels show GFP (green), F-actin (magenta) and DAPI (blue) staining of cancer-associated fibroblasts (CAFs) following transfection with GFP or GFP-tagged wild-type (wt) or IS mutant (IS) Cdc42EP3 (CEP3) proteins. The grayscale panels show individual channel magnifications of perinuclear areas. Scale bars, 25 μm. (B) Panels show GFP (green), SEPT2 (magenta) and DAPI (blue) staining of CAFs following transfection with GFP or GFP-tagged wild-type (wt) or IS mutant (IS) Cdc42EP3 (CEP3) proteins. The grayscale panels show individual channel magnifications of perinuclear areas. Scale bars, 25 μm. (C) Left panels show images of GFP (green), pS19-MLC2 (magenta) and DAPI (blue) staining of CAFs following transfection with GFP or GFP-tagged wild-type (wt) or IS mutant (IS) Cdc42EP3 (CEP3) proteins. Right panels show GFP (green), pY118-Paxillin (magenta) and DAPI (blue) staining of CAFs following transfection with GFP or GFP-tagged wild-type (wt) or IS mutant (IS) Cdc42EP3 (CEP3) proteins. Scale bars represent 25 μm.

Figure 4. Modulating the activity of Cdc42 in CAFs affects Cdc42EP3 localization and septin and F-actin organization. (A) Panels show GFP (green), F-actin (magenta) and myc (blue) staining of cancer-associated fibroblasts (CAFs) stably expressing Cdc42EP3-GFP following transfection with empty vector, myc-Cdc42-N17 or myc-Cdc42-V12. The grayscale panels show individual channels as indicated. Scale bars, 25 μm. (B) Panels show GFP (green), SEPT2 (magenta) and myc (blue) staining of cancer-associated fibroblasts (CAFs) stably expressing Cdc42EP3-GFP following transfection with empty vector, myc-Cdc42-N17 or myc-Cdc42-V12. The grayscale panels show individual channels as indicated. Scale bars, 25 μm.
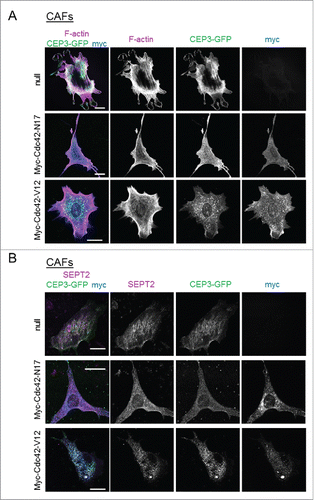
Figure 4. Modulating the activity of Cdc42 in CAFs affects Cdc42EP3 localization and septin and F-actin organization. (A) Panels show GFP (green), F-actin (magenta) and myc (blue) staining of cancer-associated fibroblasts (CAFs) stably expressing Cdc42EP3-GFP following transfection with empty vector, myc-Cdc42-N17 or myc-Cdc42-V12. The grayscale panels show individual channels as indicated. Scale bars, 25 μm. (B) Panels show GFP (green), SEPT2 (magenta) and myc (blue) staining of cancer-associated fibroblasts (CAFs) stably expressing Cdc42EP3-GFP following transfection with empty vector, myc-Cdc42-N17 or myc-Cdc42-V12. The grayscale panels show individual channels as indicated. Scale bars, 25 μm.

Figure 5. The Cdc42EP/BORG family of Cdc42 effectors. (A) Schematic showing the different BORG protein domains. (B) The BORG homology 3 (BD3) domains of Cdc42EP1-5, with conserved residues in red. Key residues within that region are underlined. (C) Direct alignments of the putative actin binding domain of Cdc42EP3, in comparison with other BORGs. This domain is absent in Cdc42EP5. Conserved residues are in red, key residues are underlined. (D) Model outlining the role of Cdc42EP3 and septins in the emergence of CAFs. Tumor cell-derived soluble factors promote the upregulation of Cdc42EP3 expression in NFs. This results in an altered cytoskeletal network with increased septin-actin cohesion and isomeric tension. As a result, cellular responses to mechanical stimulation are potentiated, leading to signaling and transcriptional adaptations (e.g. YAP activation) required for the emergence of a fully activated CAF phenotype. (Right) Immunofluorescence of the perinuclear region in CAFs, showing co-localization of Cdc42EP3 (green), F-actin (magenta) and SEPT2 (yellow).
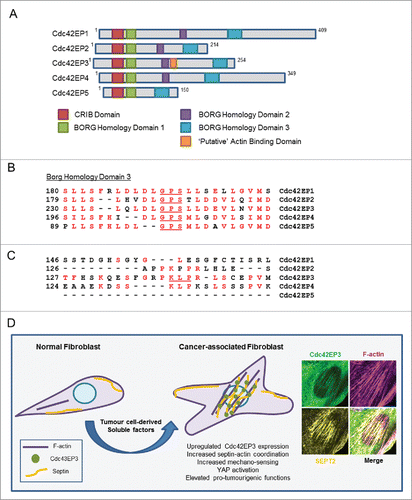
Figure 5. The Cdc42EP/BORG family of Cdc42 effectors. (A) Schematic showing the different BORG protein domains. (B) The BORG homology 3 (BD3) domains of Cdc42EP1-5, with conserved residues in red. Key residues within that region are underlined. (C) Direct alignments of the putative actin binding domain of Cdc42EP3, in comparison with other BORGs. This domain is absent in Cdc42EP5. Conserved residues are in red, key residues are underlined. (D) Model outlining the role of Cdc42EP3 and septins in the emergence of CAFs. Tumor cell-derived soluble factors promote the upregulation of Cdc42EP3 expression in NFs. This results in an altered cytoskeletal network with increased septin-actin cohesion and isomeric tension. As a result, cellular responses to mechanical stimulation are potentiated, leading to signaling and transcriptional adaptations (e.g. YAP activation) required for the emergence of a fully activated CAF phenotype. (Right) Immunofluorescence of the perinuclear region in CAFs, showing co-localization of Cdc42EP3 (green), F-actin (magenta) and SEPT2 (yellow).