Figures & data
Figure 1. Clinically relevant PKCɩ-targeted combination therapies for treatment of KRAS LADC. “Vertical Blockade” of the PKCɩ-ELF3-Notch3 signaling axis and “Horizonal Blockade” of PKCɩ and mTOR signaling pathways are denoted.
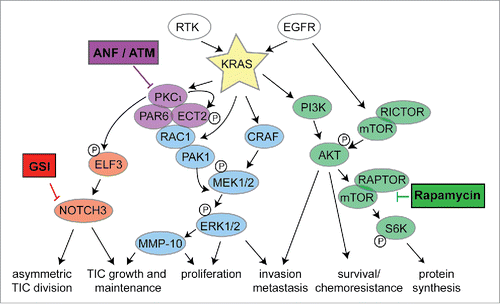
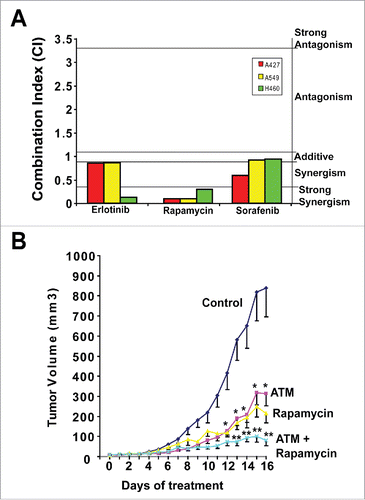
Figure 2. ATM and rapamycin exhibit synergistic growth inhibitory activity against KRAS LADC. (A) Combination Index (CI) analysis of ATM combined with Erlotinib, rapamycin and sorafenib for inhibition of anchorage independent growth of KRAS LADC cells. (B) Combined ATM and rapamycin significantly inhibits growth of H460 KRAS LADC xenograft tumors. Mice were treated with ATM (60 mg/kg/day) and/or rapamycin (5 mg/kg/day) or diluent alone (control). Mean +/− SE is plotted. n = 8–9/group. *p < 0.05 versus control; **p < 0.05 vs. rapamycin or ATM alone.