Figures & data
Figure 1. RhoH and Kaiso interact and co-localize in Jurkat T cells. (A) Interaction of HA-RhoH and the Kaiso complex were confirmed by co-immunoprecipitation. Jurkat cells transduced with retroviral vectors expressing HA-RhoH-IRES-YFP were subjected to IP with anti-HA monoclonal antibody and analyzed by immunoblotting with anti-Kaiso monoclonal antibody. Position of interacting Kaiso is indicated by arrowhead. IgG control is shown in left lane. Size marker is shown on right. A representative immunoblot of 3 independent experiments that gave similar results is shown. (B) Co-localization of RhoH and Kaiso in Jurkat cells. Jurkat cells were stained with polyclonal anti-RhoH antibody (green), monoclonal anti-Kaiso antibody (red) and nuclear staining with DAPI (blue). Arrowheads indicate co-localization readily apparent in cytosol and areas of cell protrusion. Cell Images were captured by Zeiss LSM 700 Laser Scanning Confocal-Microscope with 63X magnification and processed by ZEN software (Zeiss). Panels on the right show higher magnification (126X) of cell outlined by box in lower magnification veiw. This result represents 3 independent experiments. Mouse IgG and rabbit IgG were used as negative controls respectively and showed no signals (data not shown).
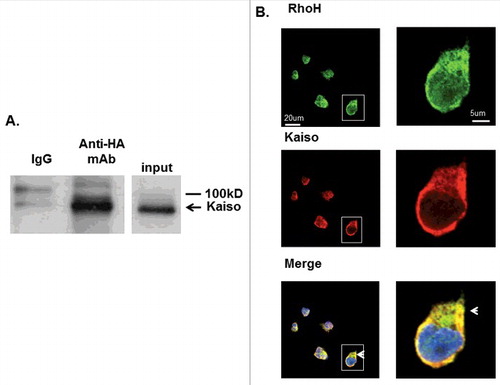
Figure 2. SDF-induced Kaiso co-localization in cell protrusions is RhoH dependent. (A) Co-localization of RhoH and Kaiso at cell protrusion sites and nucleus after SDF-1 stimulation. Jurkat cells were stimulated with SDF-1 (200 ng/ml) for the indicated time points, fixed and stained with polyclonal anti-RhoH antibody (green), monoclonal anti-Kaiso antibody (red) and nuclear staining with DAPI (blue). Cell images were captured by Zeiss LSM 700 Laser Scanning Confocal-Microscope with 63X magnification and processed by ZEN software (Zeiss). RhoH and Kaiso co-localized at cell protrusion sites 30 sec. after SDF-1 stimulation (indicated by arrow) then started to co-localize in the cytosol and nucleus by 2 min. This shift in localization increased over 15 min (indicated by arrowhead) with a concomitant reduction in membrane localization. The higher magnification images of 15 minutes stimulation are shown at bottom column. Represenative images of 3 independent experiments are shown. (B) Cell fractionation and immunoprecipitation of HA-RhoH and Kaiso complex after SDF-1 stimulation. Jurkat cells transduced with a retrovirus expressing HA-RhoH-IRES-YFP were stimulated with SDF-1 (200 ng/ml) for the indicated time points. Subsequently cells were separated into nuclear, cytosolic fractions. The cell lysates from each fraction were subjected to IP with anti-HA monoclonal antibody and analyzed by immunoblotting with anti-Kaiso monoclonal antibody. HA-RhoH transduced Jurkat cells were stimulated with SDF-1 (200ng/ml) for the times indicated and fractionated into nuclear and cytosolic fractions. The HA-immunoprecipitated fractions (20ug) were analyzed for purity by immune blotting with anti-GAPDH antibody (cytosol) and anti-Histone polyclonal antibody (nuclear). A representative example of 3 independent experiments is shown. Abbreviations: c, unstimulated control. (C) RhoH knockdown is associated with the loss of Kaiso localization at SDF-1-induced cell protrusion sites. Jurkat cells transduced with scrambled control or RhoH shRNA were stimulated with SDF-1 (200 ng/ml) for 2 minutes. Stimulated cells were stained with monoclonal anti-Kaiso antibody (purple), rhodamine-phalloidin (red) to detect F-actin and nuclear DAPI staining (blue). Cell images were captured by Zeiss LSM 700 Laser Scanning Confocal-Microscope with 63X magnification and processed by ZEN software (Zeiss). Note decreased intensity of cortical Kaiso staining and increase in F-action at cell protrusion sites (indicated by arrowheads) following SDF-stimulation in RhoH knockdown cells.
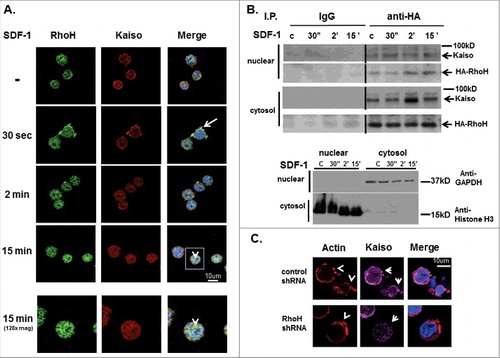
Figure 3. Sequential SDF-1 induced Kaiso localization at cell protrusion sites and in nucleus requires RhoH function in primary T cells of wildtype and Rhoh−/− mouse spleens. (A) T cells isolated from wildtype (WT) and Rhoh−/− mouse spleens were stimulated with SDF-1 (200ng/ml) for 30 seconds and stained with anti-Kaiso monoclonal antibody (red) and nuclear DAPI (blue). (B) Isolated T cells were stimulated with SDF-1 (200ng/ml) for 15 minutes and stained with anti-Kaiso monoclonal antibody (red) and nuclear DAPI (blue). Cell images were captured by Zeiss LSM 700 Laser Scanning Confocal-Microscope with 63X magnification and processed by ZEN software (Zeiss). Top row is WT and lower row is Rhoh−/− T cells.
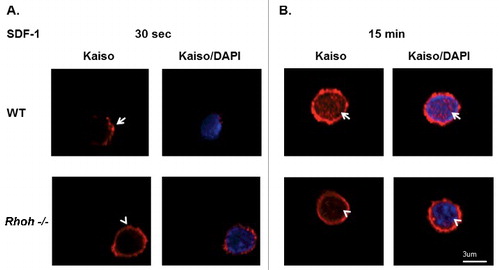
Figure 4. Knockdown of Kaiso is associated with constitutive activation of Rac. GTP-bound (active) Rac is increased at baseline and fails to respond to SDF-1 stimulation after knockdown of Kaiso in Jurkat cells. Rac activity was assessed by PBD pull-down assays and compared to total Rac protein in lysates from Jurkat cells transduced with control or Kaiso shRNA lentivirus and stimulated with SDF-1 (200 ng/ml) for 2 minutes. A representative immunoblot of 3 independent experiments is shown.
Figure 5. Kaiso regulates F-actin assembly and cell migration. (A) Kaiso knockdown in Jurkat cells leads to enhanced SDF-1 induced actin-polymerization. Control and Kaiso shRNA transduced Jurkat cells were stained with rhodamine-phalloidin (red) to detect F-actin and nuclear DAPI staining (blue). Cell images were captured by Zeiss LSM 700 Laser Scanning Confocal-Microscope with 63X magnification and processed by ZEN software (Zeiss). (B) Quantification confirmed increased polymerization of F-actin in Kaiso knockdown Jurkat cells. F-actin staining intensities in Kaiso compared with control shRNA transduced Jurkat cells after 2 min. SDF-1 (200 ng/ml) stimulation were quantified using ImageJ software. Y-axis represents the intensity of actin staining per cell. Data represent mean+/− SD (N = 10), **P < 0.01. (C) Enhanced SDF-1 induced cell migration of Jurkat cells after Kaiso knockdown. Jurkat cells transduced with lentivirus expressing control and Kaiso shRNA were subjected to transwell migration assays without (left)/with (right) 100 ng/ml SDF-1 as chemoattractant in the lower chamber. Cells in the lower chambers were counted after 3 hours incubation. Ratios of migrating cells/ input cells are shown as percentage migrating cells. Data represent mean +/− SD (N = 10), **P<0.01. Experiments were repeated 3 times for each condition.
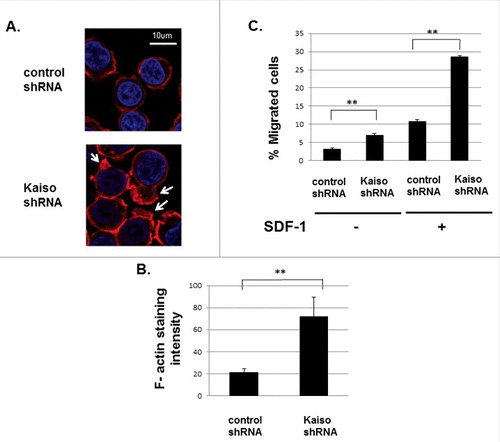
Figure 6. RhoH and P120 catenin co-localize in Jurkat cells. (A) Immunoprecipitation of HA-RhoH and the p120 catenin complex. Jurkat cells transduced with retroviral vectors expressing HA-RhoH-IRES-YFP were subjected to immunoprecipitation with anti-HA monoclonal antibody and analyzed by immune blotting with anti-p120 catenin monoclonal antibody. IgG control is shown in left lane. Position of p120 catenin in right lane is noted by arrowhead. Size marker is shown on the left. This result is representative of 3 independent experiments. (B) Co-localization of RhoH and p120 catenin in Jurkat cells. Jurkat cells were fixed and stained with polyclonal anti-RhoH antibody (green), monoclonal anti-p120 catenin antibody (red) and nuclear staining with DAPI (blue). Arrowheads indicate co-localization readily apparent in the cytosol and at the membrane. Cell Images were captured by Zeiss LSM 700 Laser Scanning Confocal-Microscope with 63X magnification and processed by ZEN software (Zeiss). Mouse IgG and rabbit IgG were used as negative controls respectively and showed no signals (data not shown). (C) Co-localization of RhoH and p120 catenin at cell protrusion sites after SDF-1 stimulation in Jurkat cells. Jurkat cells were stimulated with SDF-1 (200 ng/ml) for 2 minutes, fixed and stained with polyclonal anti-RhoH antibody (green), monoclonal anti-p120 catenin antibody (red) and nuclear staining with DAPI (blue). Arrowheads indicate co-localization of RhoH and p120 catenin in cytosol and at areas of cell protrusion. SDF-1 induced cell protrusion stractures (arrowhead) were observed in that is not observed in . Cell Images were captured by Zeiss LSM 700 Laser Scanning Confocal-Microscope with 63X magnification and processed by ZEN software (Zeiss). Mouse IgG and rabbit IgG were used as negative controls respectively and showed no signals (data not shown).
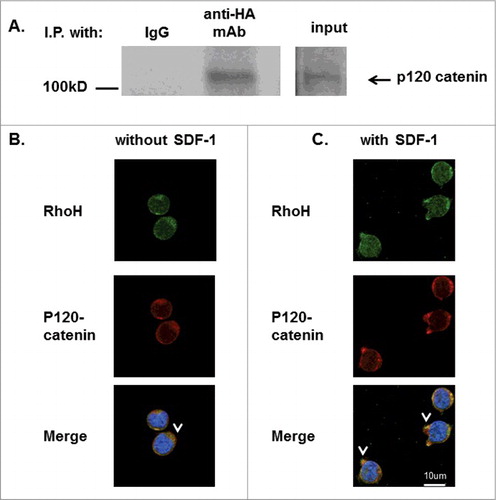
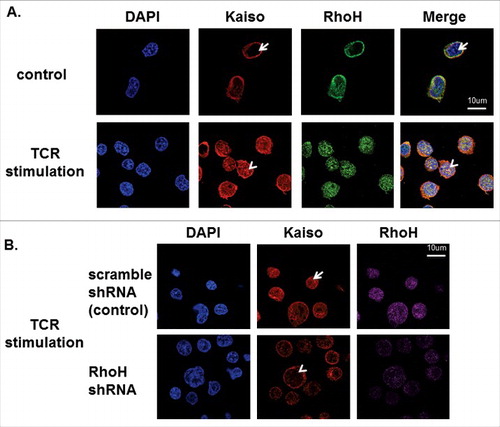
Figure 7. RhoH is required for TCR activation-induced Kaiso nuclear localization. (A) Co-localization of RhoH and Kaiso in nucleus after TCR activation. Jurkat cells were plated on anti-CD3 monoclonal antibody coated wells for 15min, fixed and stained with polyclonal anti-RhoH antibody (green), monoclonal anti-Kaiso antibody (red) and nuclear staining with DAPI (blue). Cell Images were captured by Zeiss LSM 700 Laser Scanning Confocal-Microscope with 63X magnification and processed by ZEN software (Zeiss). RhoH and Kaiso co-localized in the nucleus indicated by arrowhead vs. arrow. Represenative images of 3 independent experiments are shown. (B) RhoH knockdown is associated with the loss of Kaiso nuclear localization after TCR activation. Jurkat cells transduced with control or RhoH shRNA were plated on anti-CD3 monoclobnal antibody coated wells for 15min and then stained with monoclonal anti-Kaiso antibody (red), RhoH (purple) and nuclear DAPI staining (blue). Cell images were captured by Zeiss LSM 700 Laser Scanning Confocal-Microscope with 63X magnification and processed by ZEN software (Zeiss). The loss of RhoH and Kaiso co-localization in the nucleus indicated by arrowhead vs. arrow. The images were analyzed in a Z axis single plane with 0.9um thickness to address Kaiso nuclear localization.