
Figures & data
Figure 1. ARHGEF2 expression correlates to KRAS dependency and influences survival. (A, B) Growth curves and western blots of the indicated cell lines expressing shRNA GFP control or one of 2 shRNAs targeting KRAS (A) or one of 2 shRNAs targeting ARHGEF2 (B). Growth rates were monitored over the indicted time course using the Essen Incucyte Zoom. Western analysis of KRAS and ARHGEF2 expression was examined 72 hours post infection. Quantification of KRAS (A) and ARHGEF2 (B) is indicated. (C) Correlation between the LOG2 normalized dependency index (DI) for ARHGEF2 and KRAS in the indicated pancreatic cancer cell lines. Cells were treated with KRAS or ARHGEF2 targeting shRNAs for 5 d and dependency index (DI) was calculated (see methods). Inset: β-actin normalized expression of ARHGEF2 mRNA in the indicated pancreatic cancer cell lines. The p-value indicates significant Pearson correlation between ARHGEF2 mRNA and LOG2 ARHGEF2 DI. (D) Western blot analysis of cleaved caspase-3 and p-ERK activation in Panc-1 and MiaPaCa-2 cell lines following acute knockdown of KRAS or ARHGEF2 with siRNA (siRNA 5 nM final). Lysates were probed with indicted antibodies 72 hours post transfection. Quantification of p-ERK is the average from 4 independent measurements.
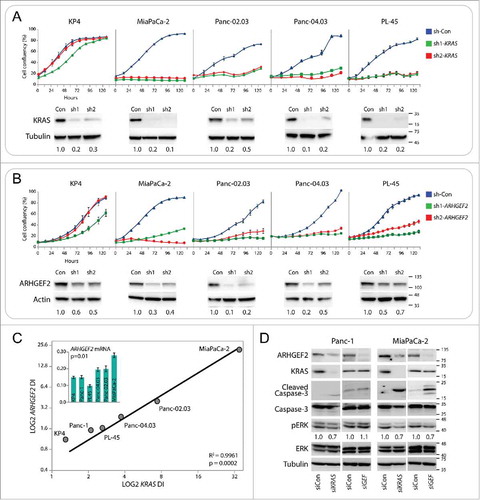
Figure 2. Enforced ARHGEF2 expression desensitizes cells to AZD6244 treatment via activation of the MAPK pathway. (A) Growth curves of doxycycline inducible ARHGEF2Δ87–151-GFP-MiaPaCa-2 cells grown in the absence (open shapes, low ARHGEF2) or in the presence of doxycycline (filled shapes, high ARHGEF2) treated with the indicated doses of AZD6244. Growth rates were monitored over the indicted time course using the Essen Incucyte Zoom. (B) Western blot analysis of p-ERK activation in doxycycline inducible ARHGEF2Δ87–151-GFP MiaPaCa-2 cells grown in the absence [-dox] or in the presence of doxycycline [+dox]. Lysates were probed with the indicted antibodies 24 hours post induction of ARHGEF2Δ87–151-GFP. GAPDH served as a loading control. Quantification of p-ERK is indicated. (C) Normalized luciferase activity generated from the minimal ARHGEF2 promoter (AP-min) or pGL3-Basic empty vector control (EV) transfected in doxycycline inducible ARHGEF2Δ87–151-GFP MiaPaCa-2 cells grown in the absence [-] or in the presence of doxycycline [+]. Cells were treated with the indicated doses of AZD6244 8 hours after induction of ARHGEF2. Luciferase activity was normalized to renilla expression and data are plotted as the fold change over empty vector. Error bars represent standard deviations from 3 independent transfections.
![Figure 2. Enforced ARHGEF2 expression desensitizes cells to AZD6244 treatment via activation of the MAPK pathway. (A) Growth curves of doxycycline inducible ARHGEF2Δ87–151-GFP-MiaPaCa-2 cells grown in the absence (open shapes, low ARHGEF2) or in the presence of doxycycline (filled shapes, high ARHGEF2) treated with the indicated doses of AZD6244. Growth rates were monitored over the indicted time course using the Essen Incucyte Zoom. (B) Western blot analysis of p-ERK activation in doxycycline inducible ARHGEF2Δ87–151-GFP MiaPaCa-2 cells grown in the absence [-dox] or in the presence of doxycycline [+dox]. Lysates were probed with the indicted antibodies 24 hours post induction of ARHGEF2Δ87–151-GFP. GAPDH served as a loading control. Quantification of p-ERK is indicated. (C) Normalized luciferase activity generated from the minimal ARHGEF2 promoter (AP-min) or pGL3-Basic empty vector control (EV) transfected in doxycycline inducible ARHGEF2Δ87–151-GFP MiaPaCa-2 cells grown in the absence [-] or in the presence of doxycycline [+]. Cells were treated with the indicated doses of AZD6244 8 hours after induction of ARHGEF2. Luciferase activity was normalized to renilla expression and data are plotted as the fold change over empty vector. Error bars represent standard deviations from 3 independent transfections.](/cms/asset/5db2cc85-0ac2-405a-9787-1eb5b5184b1a/ksgt_a_1337545_f0002_c.jpg)