Figures & data
Figure 1. Autophagy is activated in lateral cells and controls early elongation downstream of AMPK. A) Confocal images showing autophagosomes, labelled by GFP::LGG-1 (green), observed in hypodermal cells, identified using the F-actin binding probe ABD::mCherry marker (red), during early elongation. Scale bar: 10 μm. B) Graph bar representing the average number of autophagosome in dorsal and in lateral anterior cells C) Graph bar representing the average ratio of autophagosome number in lateral versus dorsal cells. D) Confocal images showing autophagosome labelled by GFP::LGG-1 in embryo submitted to RNAi against indicated genes. E) Graph bar representing the average number of autophagosome in embryo submitted to RNAi against the indicated genes. F) Graph bar representing average deformation rate (AD in μm/min) of transversal junctions in wt, let-502(RNAi), aak-1/2(RNAi), bec-1(RNAi) and epg-8(RNAi) embryos expressing AJM-1::GFP and VAB-10(ABD)::mCherry. t test p-values only significant difference from wt (*) are indicated. Error bars indicate SEM. N indicates the number of embryos used for the quantifications.
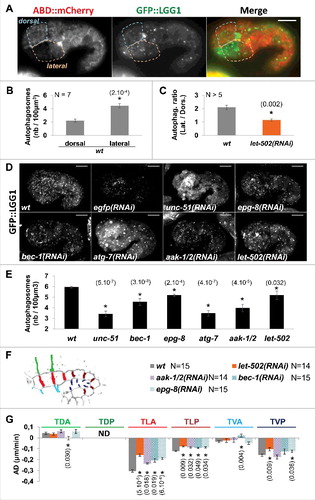
Figure 2. aak-1/2, bec-1 and epg-8 control the morphogenesis of lateral hypodermal cells as part of the RhoA-like program. A) DIC images showing embryo at the end of early elongation in wt, epg-8(RNAi), aak-1/2(RNAi), let-502(sb118ts), let-502(sb118ts);epg-8(RNAi) and let-502(sb118ts);aak-1/2(RNAi) animals. B) Graph bar representing the length of the embryos at the end of the early elongation in wt, pak-1(ok448), pix-1(gk416), let-502(sb118ts) at 25.5°C and aak-1(tm1944);aak-2(ok524) animals treated by RNAi against eGFP (control), aak-1;aak-2 or let-502. C) Schematic representation of embryos indicating the L2 transversal junctions between lateral anterior cells. D) Graph bar representing average deformation (AD) of L2 junctions in embryos with indicated genotypes. T-test p-values are indicated in parentheses. *, T-test p-value significantly different from wt (A and C) or egfp(RNAi) (B). Error bars indicate SEM. N indicates the number of embryos used for the quantifications.
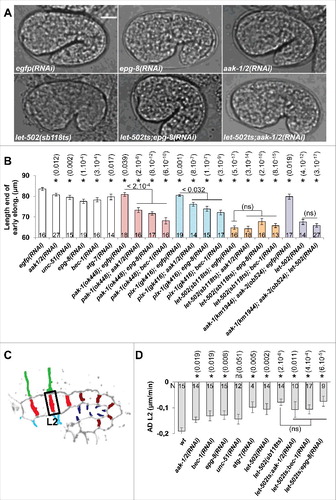
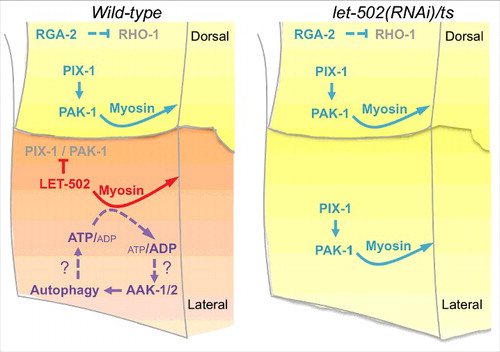
Figure 3. Data presented in this study are in agreement with the following model. In wild-type embryos (left panel), high level of myosin contraction downstream of ROCK/LET-502 activation may induce a reduction of the ATP/ADP ratio resulting to the activation of the AMPK/AAK-1/2. Autophagy activation downstream of AMPK may result to the generation of ATP, which supports myosin contraction. Upon let-502 knock-down (right panel), the Rac1-like program involving PIX-1 and PAK-1 controls the remodelling of cell-cell junctions between lateral cells in an AMPK and autophagy-independent manner.