Figures & data
Figure 1. GRAF3 depletion promoted RhoA/MRTFA-dependent SMC contractile gene expression. a-c. Aortic SMC were isolated from wild type (wt) or GRAF3gt/gt mice (gt) and contractile gene expression was measured by RT-PCR or Western blot (panel a, representation; panel c shows quantification from 3 separate experiments and values are expressed as mean +/- SEM. *<0.05). Smooth muscle α-actin (SMA), calponin (CNN1), smooth muscle myosin heavy chain (MHC). In panel b, cell isolates were treated with LacZ (control) or Cre adenovirus to assess the capacity of GRAF3 re-expression to reverse changes in gene expression. d. Human coronary (HuCo) SMC were treated with control (Csi) or GRAF3 (G3si) siRNA for 72 hr. and marker expression was assessed as in panel a. Quantification is shown from 3 separate experiments and values are expressed as mean +/- SEM. † p < 0.1; *<0.05; **p < 0.01. e, f. GRAF3 depletion enhanced actin polymerization (F-actin, red) and nuclear accumulation of GFP-MRTFA in transfected 10T1/2 cells treated with or without 10% serum for 1 hr. f, quantification of MRTFA staining in the nucleus (nuc), cytoplasm (cyto.) or diffuse in 4 separate experiments with at least 50 cells per condition g. GRAF3 depletion (G3) enhanced nuclear accumulation of endogenous MRTFA in rat aortic SMC treated with or without sphingosine 1-phosphate (S1p) for 1 hr as assessed by nuclear fractionation followed by Western blotting. Histone H3 (H3) is shown as a control h,i. SMC were treated with Csi or G3si as in panel g. Cells were treated with latrunculin B (LB, 10 μM) or vehicle for the last 24 hr. prior to assessing marker gene expression. Data from 3 separate experiments were quantified and values are expressed as mean +/- SEM. *<0.05.
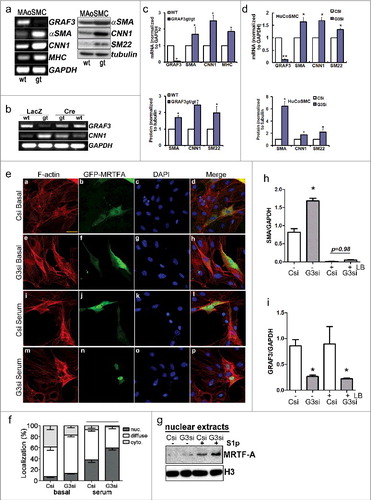
Figure 2. GRAF3 expression directly correlates with plasma volume in TGFβ1 hypo/hypermorphic mice. a, c. GRAF3 (relative to GAPDH) mRNA levels in kidneys from Tgfb1L/L (L/L), Tgfb1L/+ (L/+), Tgfb1+/+ (WT), Tgfb1H/+ (H/+), and Tgfb1H/H (H/H) male mice with genetically graded expression of TGFβ1 from 10% (L/L) to 300% (H/H) normal was measured by qRT-PCR. GRAF3 (relative to GAPDH) mRNA levels were plotted against plasma volume as a % of BW. L (low); H (high).(a) or systolic blood pressure in mmHg (c). b. Rat aortic SMC were treated with TGF-β for 72 hr and GRAF3 mRNA was quantified and normalized to GAPDH. (d) Schematic representation of GRAF3-dependent counter-regulation of vessel tone.