Figures & data
Figure 1. The recruitment of ER-derived proteins to DC phagosomes is independent of Rab22a. (A) Immunoblotting of Rab22a and Sec22b in JAWS-II DCs infected with lentiviruses encoding a random sequence (Scramble) and a shRNA specific for silencing Rab22a (Rab22a KD). Ponceau S staining was used as protein loading control. Data are representative of at least three independent experiments. (B) Scramble and Rab22a KD JAWS-II DCs were incubated with 3 µm magnetic beads for 15 min at 37°C and chased for 0 or 45 min. The panel shows immunoblotting of purified phagosomes (on the left) and the total cell lysates (on the right) analyzed for the ER markers Tapasin and Calreticulin, and for the lysosomal marker Lamp1. A total protein amount of 15 µg and 50 µg was loaded for purified phagosomes and total cell lysates, respectively. The blot is representative of three independent experiments. (C) Densitometry quantification of Tapasin Western blot analysis of three independent phagosomal preparations from Scramble (black dots) and Rab22a KD (red dots) DCs. P for 15 min = 0.2230 (ns) and P for 60 min = 0.5629 (ns). (D) Immunofluorescence labelling and confocal microscopy analysis showing the distribution and recruitment to 3 µm latex beads-containing phagosomes of endogenous Lamp1 (green), Calreticulin (red) and Rab22a (magenta) in Scramble and Rab22a KD JAWS-II DCs. Nuclei stained with DAPI and DIC images are shown on the left. Overlays are shown in the right panels. An inset of higher magnification is shown for a Scramble Lamp1/Calreticulin positive phagosome. Scale bars: 5 µm. Data are representative of three independent experiments. (E) Quantification of Lamp1/Calreticulin positive phagosomes from Scramble and Rab22a KD JAWS-II DCs of three independent experiments. A total of 75 Lamp1 positive phagosomes were analyzed, and the number of Lamp1/Calreticulin double-positive phagosomes was determined for each cell type (27/75 for Scramble and 28/75 for Rab22a KD). P = 0.5322 (ns). In C and E, the two-tailed Student's paired t test was performed.
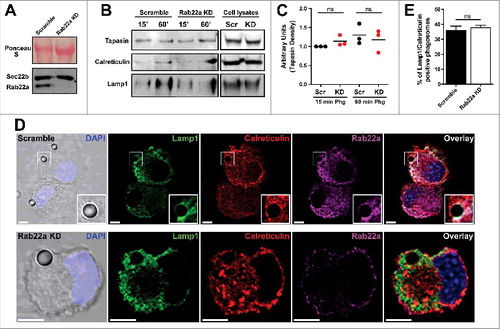
Figure 2. Rab22a regulates the acquisition of ER-derived proteins to DC endosomes. (A) Immunofluorescence labelling and confocal microscopy analysis showing endogenous Calreticulin (red), Rab22a (magenta) and endosomes containing fluorescent soluble OVA (OVA-FITC, green) after 1 h of internalization by Scramble and Rab22a KD JAWS-II DCs. Nuclei stained with DAPI and DIC images are shown on the left. Insets showing the overlay of OVA and Calreticulin are depicted in the right panels. White arrows point OVA/Calreticulin double-positive endosomes. Scale bars: 5 µm. Images are representative of three independent experiments. (B) Quantification of OVA/Calreticulin positive endosomes from Scramble and Rab22a KD JAWS-II DCs of three independent experiments. From a total of more than 200 OVA positive endosomes, the number of Calreticulin positive endosomes was determined for each cell type (94/215 for Scramble and 63/202 for Rab22a KD). * P = 0.0289. (C-E) Endosome to cytosol export was assessed by measuring Annexin V staining by FACS analysis after the internalization of exogenously added cytochrome C. Histograms showing the differences of the mean fluorescent intensities (MFI) of Annexin V labelling in JAWS-II DCs treated without cytochrome C (gray) or with 10 mg/ml of cytochrome C (black lines) between Scramble (C) and Rab22a KD (D) cells. (E) Delta of Annexin V MFI values (10 mg/ml cytochrome C – 0 mg/ml cytochrome C) in Scramble and Rab22a KD DCs. Data show mean ± SEM from triplicate values and are representative of five independent experiments. ** P = 0.0046. (F-G) FACS histograms showing the shift in the Annexin V (FITC) and TO-PRO-3 Iodide staining after the incubation with 10 mg/ml of cytochrome C in Scramble (F) and Rab22a KD (G) JAWS-II DCs. Red values at the lower right quadrants indicate the percentages of apoptotic/non-necrotic cells that constitute the analyzed DC populations. Data are representative of five independent experiments. In B and E, the two-tailed Student's paired t test was performed.
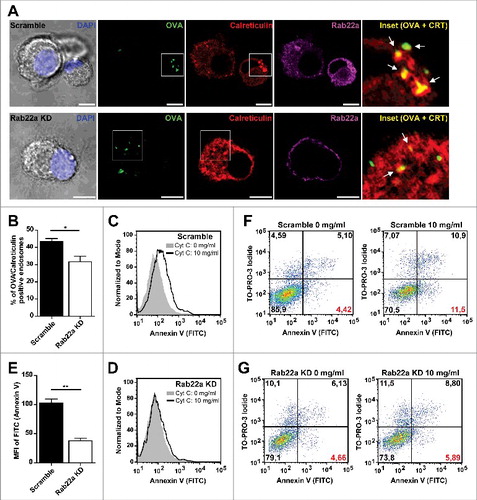
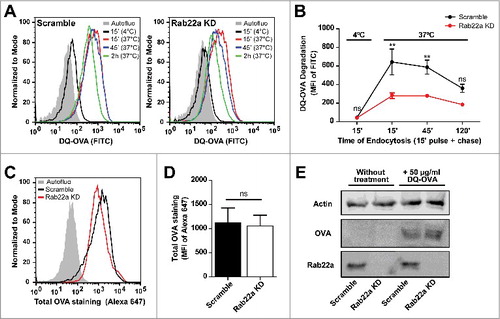
Figure 3. Endosomal maturation is altered in Rab22a KD DCs. (A) Representative FACS profiles showing the MFI corresponding to DQ-OVA degradation by Scramble (left) and Rab22a KD (right) JAWS-II DCs after the incubation for 15 min at 4°C, or for 15 min and chased for 0, 30 and 105 min at 37°C. (B) Quantification of the soluble DQ-OVA degradation ability measured by flow cytometry at the indicated time periods by Scramble and Rab22a KD JAWS-II DCs. Data represent mean ± SEM from triplicate values of three independent experiments. **P < 0.01 and P > 0.05 (ns). (C) Representative FACS profiles showing the MFI corresponding to the total amount of soluble DQ-OVA internalized by Scramble and Rab22a KD JAWS-II DCs after the incubation for 15 min at 37°C. Cells were fixed, permeabilized and labeled with an anti-OVA and a secondary antibody conjugated with Alexa 647. (D) Quantification of the Alexa 647 MFI corresponding to total OVA staining after DQ-OVA internalization by Scramble and Rab22a KD cells. Data show mean ± SEM from quintuplicate values of three independent experiments. P = 0.6290 (ns). (E) Immunoblotting showing the total amount of soluble DQ-OVA incorporated by Scramble and Rab22a KD JAWS-II DCs after the incubation for 15 min at 37°C. A total protein amount of 50 µg was loaded for each lane and the cell lysates were analyzed for Actin, OVA and Rab22a. Data are representative of two independent experiments. In B, a two-way ANOVA and the Bonferroni post-test was performed and in D, the two-tailed Student's paired t test was performed.