
Figures & data
Figure 1. Protein domain structure of potential Cdc42 GEFs
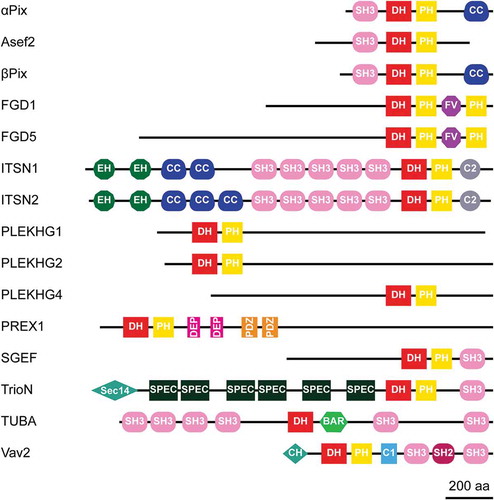
Figure 2a. Ectopic expression of potential Cdc42 GEFs induces specific phenotypes in ECs
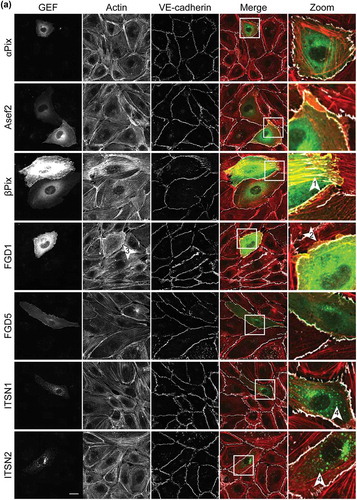
Figure 2b. (Continued)
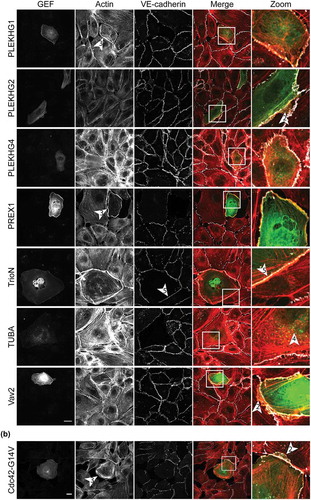
Figure 3. Workflow of GEF-mediated Cdc42 activation measurements in single ECs
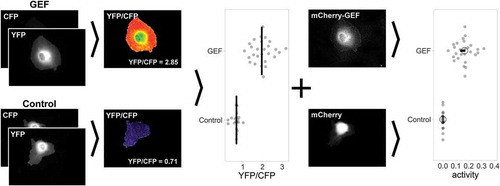
Figure 4. Ectopic expression of GEFs induce distinct Cdc42 and Rac1 activation patterns
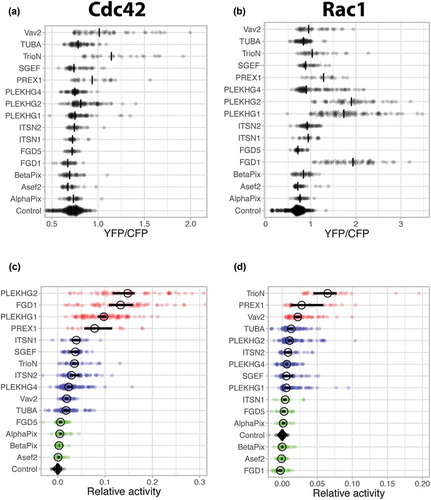
Figure 5. Ectopic expression of TIAM exclusively activates Rac1
Figure 6. Alignment of GEF DHPH domains
Figure 7. Catalytic GEF domains induce distinct Cdc42 activation profiles. For each of the indicated GEFs the relative activity of membrane-targeted (Lck) Lck-DHPH, soluble DHPH, Lck-DH, soluble DH or full-length (FL) on the Cdc42 biosensor was quantified relative to the control (mCherry). The median activity and 95% confidence intervals are indicated with a circle and a horizontal bar, respectively (except for the ‘DH’ condition of FGD1, where only the median is indicated due to low sample size). The corresponding YFP/CFP data are represented in Supplemental Figure S3
Table 1. Generation of FL mTq2/mCherry-GEF constructs. RE = restriction enzyme, Fw = Forward primer, Rv = Reverse primer. Restriction sites are underlined in the primer sequences. Restriction sites for Asef2, PREX1 and SGEF are not present in the Fw primer
Table 2. Generation of (Lck-)mCherry-DH(PH) GEF constructs. RE = restriction enzyme, Fw = Forward primer, Rv = Reverse primer. Restriction sites are underlined in the primer sequences