Figures & data
Figure 1. LY294002 abrogates ruffle formation in NSCLC cells. A549 cells were serum starved for 24 h and then treated with PMA (0.1 μM, 30 min), in the absence or presence of the PI3K inhibitor LY294002 (20 μM, added 1 h before and kept during PMA stimulation). Cells were fixed and stained with rhodamine-phalloidin [Citation16]. Panel A. Representative micrographs of ruffle formation are shown. Panel B. Quantification of ruffle area/cell was done as previously described [Citation33]. Data are expressed as mean ± S.E.M. (n = 3). *, p < 0.05
![Figure 1. LY294002 abrogates ruffle formation in NSCLC cells. A549 cells were serum starved for 24 h and then treated with PMA (0.1 μM, 30 min), in the absence or presence of the PI3K inhibitor LY294002 (20 μM, added 1 h before and kept during PMA stimulation). Cells were fixed and stained with rhodamine-phalloidin [Citation16]. Panel A. Representative micrographs of ruffle formation are shown. Panel B. Quantification of ruffle area/cell was done as previously described [Citation33]. Data are expressed as mean ± S.E.M. (n = 3). *, p < 0.05](/cms/asset/82c65f6f-f9c1-4c40-8944-114f3f717693/ksgt_a_1684785_f0001_b.gif)
Figure 2. Effect of silencing specific Rac-GEFs on PMA-induced ruffle formation in NSCLC cells. A549 cells were transfected with specific RNAi duplexes (Dharmacon) targeting individual Rac-GEFs. After 24 h, cells were serum starved for an additional 24 h, and then treated with PMA (0.1 μM, 30 min). Ruffle formation was evaluated by microscopy after rhodamine-phalloidin staining. Panel A. Representative Q-PCR showing the specific depletion of Ect2, Trio, Vav2, and Tiam1. NTC, non-target control RNAi. ****, p < 0.0001. Panel B. Representative micrographs of ruffle formation are shown. Panel C. Quantification of ruffle area/cell was done as previously described [Citation16]. Results are expressed as percentage relative to the PMA response in parental (mocked-transfected) cells (dotted line). Data are expressed as mean ± S.E.M. (n = 3). **, p < 0.01
![Figure 2. Effect of silencing specific Rac-GEFs on PMA-induced ruffle formation in NSCLC cells. A549 cells were transfected with specific RNAi duplexes (Dharmacon) targeting individual Rac-GEFs. After 24 h, cells were serum starved for an additional 24 h, and then treated with PMA (0.1 μM, 30 min). Ruffle formation was evaluated by microscopy after rhodamine-phalloidin staining. Panel A. Representative Q-PCR showing the specific depletion of Ect2, Trio, Vav2, and Tiam1. NTC, non-target control RNAi. ****, p < 0.0001. Panel B. Representative micrographs of ruffle formation are shown. Panel C. Quantification of ruffle area/cell was done as previously described [Citation16]. Results are expressed as percentage relative to the PMA response in parental (mocked-transfected) cells (dotted line). Data are expressed as mean ± S.E.M. (n = 3). **, p < 0.01](/cms/asset/dfe0934f-403e-4a44-bfb5-745bba726c4a/ksgt_a_1684785_f0002_b.gif)
Figure 3. Differential regulation of selected Rac-GEFs by PKCε in NSCLC cells. Epithelial A549 cells were treated with TGF-β (10 ng/ml, 6 days). TGF-β transformed cells were transfected with either pcDNA-PKCε-FLAG or empty vector, and 30 h later expression levels for DOCK4 and Trio were compared to epithelial A549 cells. Panel A. Protein levels of DOCK4 and Trio were determined by western blot using specific antibodies. A representative experiment is shown. Panel B. Densitometric analysis, normalized to actin. Data are expressed as percentage expression in mesenchymal cells relative to epithelial cells, and represent the mean ± S.E.M. (n = 3). Dotted line, epithelial A549 cells. *, p < 0.05; **, p < 0.01; n.s. non significant
Table 1. Expression of selected Rho-GEFs in ‘epithelial’ vs. ‘mesenchymal’ NSCLC cells. mRNA was obtained from A549 cells before (‘epithelial’) and after TGF-β treatment (10 ng/ml) for 6 days (‘mesenchymal’). cDNA was prepared by reverse transcription, and expression of Rho-GEFs was determined by Q-PCR. Results were normalized to a housekeeping gene (UBC). Results are expressed as fold-change in ‘mesenchymal’ cells relative to ‘epithelial’ cells. Data represents the mean ± S.E.M. of 3 independent experiments
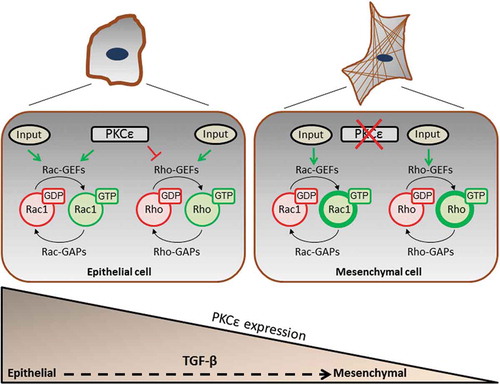
Figure 4. Model for PKCε regulation of small GTPases in NSCLC cells. In the epithelial state, PKCε promotes Rac1 activation and inhibits RhoA. PKCε is down-regulated in the ‘mesenchymal’ state, becoming a permissive signal for Rho activation and stress fibre formation