Figures & data
Figure 1. Domain composition of 56 putative human Ras effectors. Domain structure of proteins containing RA, RBD, PI3K_rbd and UB domains (in red). The Figure has been prepared following domain assignments in Table S1. Family members with similar domain compositions are only drawn once and all gene IDs are listed preceding the domains. The colour code for the additional domains follows the classification as in
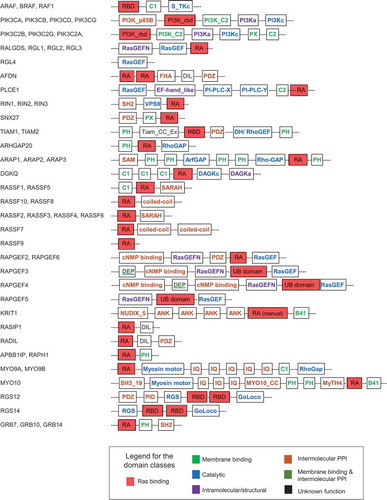
Figure 2. Protein concentrations and pathways downstream of expressed Ras effectors in colon. (a) Protein concentrations of Ras proteins and effectors in colon tissue based on the Wang et al 2019 dataset [Citation12]. The colours correspond to the 12 different downstream pathway classes associated with the 56 Ras effectors (see panel b). A star preceding the protein name indicates that protein concentrations were extrapolated from mRNA levels. (b) Ras effectors expressed in colon tissue (≥ 1 nM) are shown as circles where their sizes correspond to their protein expression levels (see legend). The 12 downstream effector pathways connect to a variety of output/responses and their known (or potential) role in colon homoeostasis and physiology
![Figure 2. Protein concentrations and pathways downstream of expressed Ras effectors in colon. (a) Protein concentrations of Ras proteins and effectors in colon tissue based on the Wang et al 2019 dataset [Citation12]. The colours correspond to the 12 different downstream pathway classes associated with the 56 Ras effectors (see panel b). A star preceding the protein name indicates that protein concentrations were extrapolated from mRNA levels. (b) Ras effectors expressed in colon tissue (≥ 1 nM) are shown as circles where their sizes correspond to their protein expression levels (see legend). The 12 downstream effector pathways connect to a variety of output/responses and their known (or potential) role in colon homoeostasis and physiology](/cms/asset/bbab3f1e-3b89-4966-869a-4e720ca1b118/ksgt_a_1724596_f0002_oc.jpg)
Figure 3. Network modelling of Ras effector interaction and competition. (a) Overlay of seven 3D complex structures with Ras displayed in grey in all structures and the UB-like domains (of effectors) shown in different colours as indicated next to the superimposition. The following pdb structures were used: 1gua.pdb for RAF1, 1he8.pdb for PIK3CG, 1lfd.pdb for RALGDS, 6amb.pdb for AFDN, 2c5l.pdb for PLCE1, 3ddc.pdb for RASSF5, and 4k81.pdb for GRB14. The superimposition and visualization was done using the SwissPdbViewer software. (b) Results of the equilibrium network analysis of nano molar concentrations of Ras-effector complexes in colon tissue. The complex formations were calculated using increasing amounts of total Ras with 100% corresponding to the total concentration of Ras for mimicking a 100% load of GTP. (c) Similar as in panel (b), but the Ras-effector complexes are here displayed in percent (normalized by the total concentration of all Ras-effector complexes)
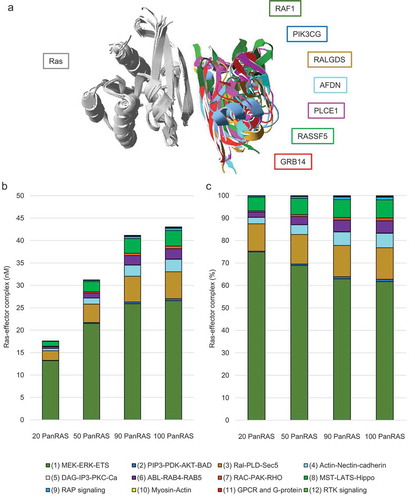
Figure 4. Results of personalized network modelling of Ras effector interaction competition in 170 CRC patients. (a) Ras (sum of H-, K-, and N-Ras) concentrations in 170 CRC patients. (b) Results of the equilibrium network analysis of 56 Ras-effector complexes added up according to the 12 effector classes in CRC tissue of 170 patients. The samples patients follow the same order as in panel (a). (c) Boxplot representation of concentrations of Ras in complex with effector class 01 (associated with the MEK_ERK_ETS pathway). (d) Boxplot representation of concentrations of Ras in complex with effector class 03 (associated with the Ral_PLD_Sec5 pathway). (e) Boxplot representation of concentrations of Ras in complex with effector class 08 (associated with the MST_LATS_Hippo pathway). (f) Correlation of the 12 Ras effector group complex concentrations in normal colon tissue (with 100% active Ras) with the average complex concentrations of the 12 Ras effector groups in CRC tissue of the 170 individuals. The arrows in panels (c), (d), and (e) indicate the concentration of complex formation in normal colon context with 100% active Ras
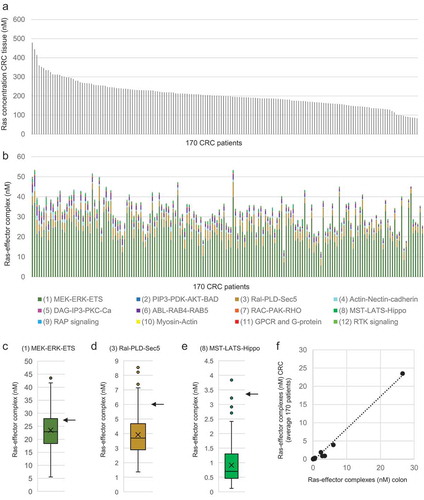
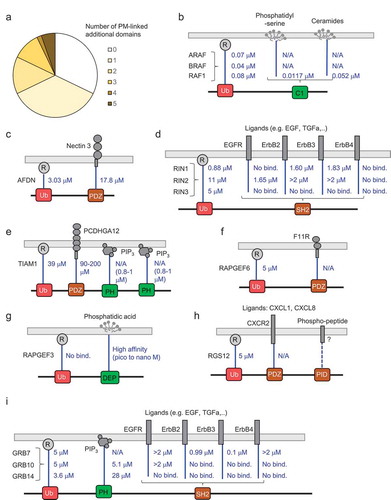
Figure 5. Additional domains in effectors that can mediate binding to the PM or PM-associated proteins. (a) Statistics for effectors and additional domains with ability to be linked to the PM. (b)-(i) Schematic representations and affinities between UB-like domains binding to Ras (R) and additional domains and their binding partners (selected examples for which affinities are available)