
Figures & data
Figure 1. Cdc42-1625 mutants display similar septation index with cdc42+ cells. (a). Representative images of cdc42+ and cdc42-1625 at permissive (25ºC) and non-permissive (36ºC) temperatures; Scale bar-10 µm. (b). Septation indices for cdc42+ and cdc42-1625 at permissive (25ºC) and non-permissive (36ºC) temperatures, each data point represents an experiment, three replicate experiments were performed. (c). Quantification of cell width in respective strains at permissive temperature (25ºC), n = 51 cells. (d). Quantification of septation index in mentioned strains, monitored with calcofluor white hourly for 4 hours in cells synchronized in S-phase with 10 mM Hydroxyurea at 36ºC. Septation index at each time point was normalized to the first peak septation index for that strain, n = 3 replicate experiments. The red lines on graph represent the mean; error bars represent standard deviation; statistics is performed with ANOVA, followed by Tukey posthoc analysis, ****P ≤ 0.0001; n.s, not statistically significant
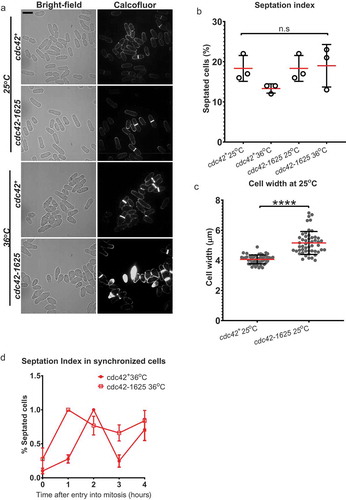
Figure 2. Proper Cdc42 function is required for Bgs1 recruitment to the medial ring during cytokinesis. (a). Sum projections showing GFP-Bgs1 and Rlc1-tdTomato localization at permissive (25°C) and non-permissive (36°C) temperatures in cdc42+ and cdc42-1625 cells, and respective DIC images. Middle panel shows middle of z-section with Rlc1-tdTomato signal to indicate how we classified non-constricting rings (two distinct dots). The white arrows point to GFP-Bgs1 localization at division site in cells with non-constricting rings. (b). Sum projections of cdc42+ and cdc42-1625 cells with magenta box showing 330 pixel2 box used to measure GFP-Bgs1 signal at the division site. (c). Fold change in GFP-Bgs1 fluorescence intensity, in cells with non-constricting rings in the indicated strains; in comparison to the intensity in cdc42+ cells at 25°C, n = 3 replicate experiments, with >32 cells for each strain in each experiment. (d). Western Blot showing global GFP-Bgs1 levels at 25°C and 36°C. (e). Quantification of the percentage of cells with rings that display Bgs1 localization, n = 2 replicate experiments, with ≥100 rings analysed per strain. (f). Quantification of the percentage of constricting rings observed among cells with an actomyosin ring in the mentioned strains, at 25°C and 36°C, number of rings analysed(n) ≥100 cells for each strain. The red lines on graph represent mean, error bars represent standard deviation; Statistics is performed with ANOVA, followed by Tukey posthoc analysis, *P ≤ 0.05; **P ≤ 0.01; ***P ≤ 0.001; ****P ≤ 0.0001; n.s., not statistically significant; Scale bars- 5 µm
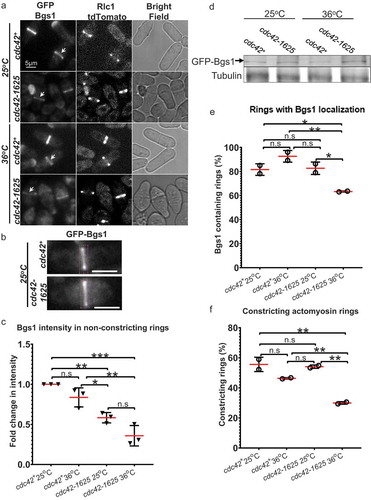
Figure 3. Cdc42 is required for proper localization of glucanases Eng1 and Agn1 during cell separation. (a). Sum projections of cells displaying GFP tagged glucanases Eng1 and Agn1 at permissive temperature (25°C) in cdc42+ and cdc42-1625 mutants, scale bar-5 µm. (b). Representative images showing localization of Eng1-GFP and Agn1-GFP in cdc42+ cells during cell separation, along with respective bright-field images. The pink boxes highlight the 3D-reconstructions of the different localization patterns of Eng1-GFP and Agn1-GFP observed in cdc42+ cells: (i) Ring, (ii) Ring + Dot, (iii) Disk. (c). Representative images showing fluorescence images of Eng1-GFP and Eng1-GFP in cdc42-1625 cells along with the respective bright-field images and 3D-reconstructed division site of Eng1-GFP Agn1-GFP localization during cell separation at 25°C. The pink boxes highlight the 3D-reconstructions of the different localization patterns of Eng1-GFP and Agn1-GFP observed in cdc42-1625 cells: Scale bar for all cells is 5 µm; Scale bar for all 3D- reconstructed division site is 2 µm. (d). Quantification of Eng1-GFP and Agn1-GFP localization patterns at the division site in the strains mentioned, n = 3 replicates with ≤28 cells each
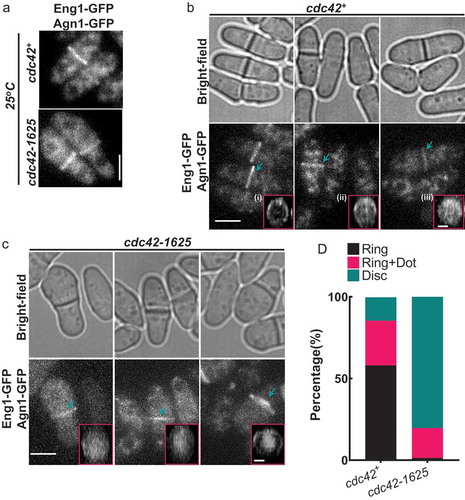
Table 1. Strains list