Figures & data
Figure 1. NS1 binds and potently inhibits murine RAS. A) The location of D132 in the crystal structure of the HRAS-NS1 complex (PDB 5E95). The ⍺4 and ⍺5 helices, switch 1 and 2, and GDP are also denoted. Alignment of the ⍺4 sequence of the human and murine KRAS is shown above the HRAS-NS1 structure. B) Yeast display binding of NS1 to human and murine KRAS isoforms bound to GDP. Affinity values (apparent KD) were as follows: human HRAS, 37 ± 2 nM; mouse KRAS, 30 ± 5 nM. Error bars represent s.d. of n = 3 independent binding experiments. a.u., arbitrary units. C) Coimmunoprecipitation of HA-tagged KRAS(G12V) orthologs with CFP-FLAG tagged NS1. Human (D132) and murine (E132) KRAS(G12V) were co-expressed with CFP-FLAG-NS1 (NS1) in HEK293 cells. D) Effects of NS1 on ERK-MAPK activation by human (D132) and murine (E132) KRAS(G12V) orthologs. HEK293 cells were co-transfected with KRAS(G12V) ortholog and either CFP or CFP-FLAG-NS1 (NS1). ERK activation by KRAS(G12V) was determined by Western blot of whole cell lysates with antibodies specific for phosphorylated ERK (pERK). Vinculin was used as a normalization control for protein loading. Quantification of relative ERK activation from 3 independent experiments ± s.d. is shown in the graph. p values correspond to the difference between pERK levels in CFP (dotted line) vs CFP-NS1 for each KRAS protein and were calculated by unpaired, two-tailed t test. E) NIH/3T3 cells were co-transfected with indicated KRAS(G12V) ortholog and either CFP- alone or CFP-FLAG-NS1. Representative plates of foci from each condition are shown. Quantification of relative foci number for each oncogene is shown in the graphs. Results represent the ratio of foci number in the presence of CFP-NS1 to that with CFP alone (dotted line) and are shown as mean ± s.d. of three independent experiments performed in triplicate. p values are shown above each column and were calculated by unpaired, two-tailed t test between CFP and CFP-NS1 for each KRAS protein.
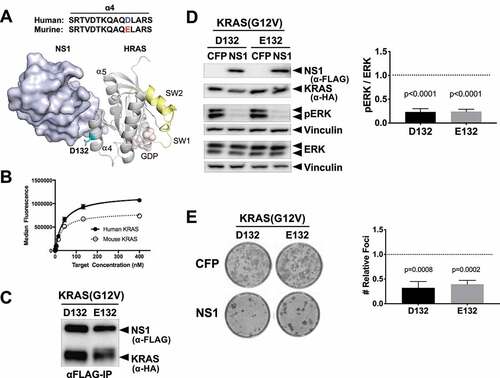
Figure 2. NS1 inhibits KRAS signalling in mouse and human PDAC cells. Mutant KRAS-expressing murine (KPC) and human (CFPAC) PDAC cell lines were infected with lentivirus encoding a doxycycline (DOX)-inducible NS1 expression construct to generate stable cell lines. A) Following DOX induction, NS1 was immunoprecipitated from both KPCNS1 and CFPACNS1 cells followed by Western blot with a KRAS antibody (OP24, Millipore Sigma). Panels below illustrate expression of proteins in whole cell lysates (WCL). B) Effects of DOX-induced NS1 expression on ERK and AKT activation in mouse KPCNS1 PDAC cells. ERK and AKT activation was measured by Western blot of cell lysates with phosphospecific antibodies. Vinculin was used as a normalization control for protein loading. C, D) Quantification of pERK (c) or pAKT (d) from KPCNS1 cell lysates in (b) was done using LI-COR Biosciences Image Studio Lite software (v.5.2.5) and presented as relative pERK or pAKT activation compared to no DOX lysates. Error bars represent s.d. from n = 3 independent experiments. p values were calculated by unpaired, two-tailed t test and are indicated on the graphs.
Figure 3. NS1 inhibits growth of KPC cells in vitro. A) Effects of DOX-induced NS1 expression on proliferation of KPCNS1 cells. Results at each time point represent the average of triplicate wells. B) Effect of DOX-induced NS1 expression on anchorage-independent growth of KPCNS1 cells. KPCNS1cells were plated in soft agar and grown ±DOX. C) Colony numbers from three independent wells for each condition were quantified using NIH ImageJ software. Graphs represent the average number of colonies per well ± s.d. p value was calculated by unpaired, two-tailed t test between -DOX and +DOX conditions and is indicated on the graphs.
Figure 4. Targeting ⍺4-⍺5 interface of KRAS inhibits PDAC tumour growth. A) C57BL/6 J mice injected with KPCNS1 cells were segregated into three groups, no DOX treatment [(-DOX); n = 7], DOX treated at day 1 post injection (PI) [+DOX(D1); n = 6] or DOX treated at day 5 PI [+DOX(D5); n = 7]. A representative mouse is shown from each cohort. Colour scale (radiance; units are photons per sec per cm2 per steradian): Min = 2.00e8, Max = 5.60e10 B) Tumour growth kinetics in various cohorts of KPCNS1 mice based on the quantification of luciferase activity by IVIS imaging. p values were calculated using mixed-effects analysis with Dunnett’s multiple comparisons test comparing -DOX group to +DOX(D1) and +DOX(D5), respectively, for each time point. ***p < 0.001, **p < 0.01, *p < 0.05, ns = not significant. C) Representative images of pancreatic tumours. D) Quantification of tumour weights. The individual weights of tumours and mice body weights (Extended Figure 4a) from the cohorts were plotted and p values were calculated using one-way ANOVA with Dunnett’s multiple comparisons test and comparing each condition to -DOX control.
![Figure 4. Targeting ⍺4-⍺5 interface of KRAS inhibits PDAC tumour growth. A) C57BL/6 J mice injected with KPCNS1 cells were segregated into three groups, no DOX treatment [(-DOX); n = 7], DOX treated at day 1 post injection (PI) [+DOX(D1); n = 6] or DOX treated at day 5 PI [+DOX(D5); n = 7]. A representative mouse is shown from each cohort. Colour scale (radiance; units are photons per sec per cm2 per steradian): Min = 2.00e8, Max = 5.60e10 B) Tumour growth kinetics in various cohorts of KPCNS1 mice based on the quantification of luciferase activity by IVIS imaging. p values were calculated using mixed-effects analysis with Dunnett’s multiple comparisons test comparing -DOX group to +DOX(D1) and +DOX(D5), respectively, for each time point. ***p < 0.001, **p < 0.01, *p < 0.05, ns = not significant. C) Representative images of pancreatic tumours. D) Quantification of tumour weights. The individual weights of tumours and mice body weights (Extended Figure 4a) from the cohorts were plotted and p values were calculated using one-way ANOVA with Dunnett’s multiple comparisons test and comparing each condition to -DOX control.](/cms/asset/3496c1c7-b915-445d-85da-2af0e670ec9f/ksgt_a_1906621_f0004_oc.jpg)
Figure 5. NS1 inhibits ERK phosphorylation and induces apoptosis in vivo. A) Lysates of KPCNS1 PDAC tumours were analysed by western blot for activation of ERK. The homogeneity of KPC cells in each tumour is illustrated by the anti-luciferase (Luc) blot. NS1 expression was seen only in DOX-treated samples. B) Caspase-3 activation was measured by Western blot using cleaved Caspase-3 (Asp175) antibody (casp3). Vinculin was used as a loading control for ERK, pERK and caspase-3 blots. Quantification of blots is shown in Extended Figure 4b and c.
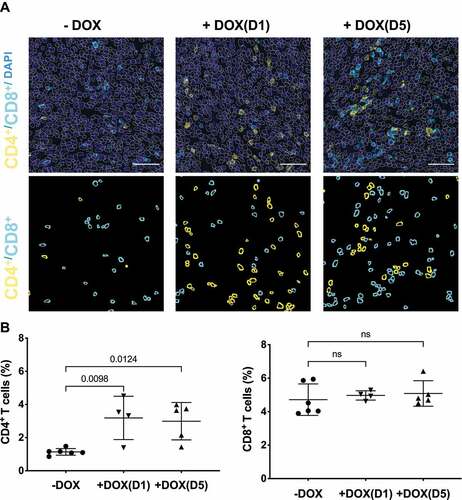
Figure 6. NS1 inhibition of KRAS stimulates an adaptive immune response. Tumours from KPCNS1 PDACs were immunophenotyped by immunohistochemistry for CD4+ or CD8+ (A) Images acquired from tumours in an untreated mouse, a mouse treated +DOX(D1), and a mouse treated +DOX(D5). First row: DAPI staining in blue, CD4 in yellow and CD8 in cyan. The segmented nuclei are overlaid as grey circles. The scale bar corresponds to 50 µm. Second row: segmentation masks showing identified CD4+ and CD8+ cells. B) Proportion of CD4+ and CD8+ cells for untreated, +DOX(D1), and +DOX(D5) mice. p values were calculated using one-way ANOVA with Dunnett’s multiple comparisons test comparing each condition to -DOX control.