Figures & data
Figure 1. Non-covalent fragment screening flowchart.
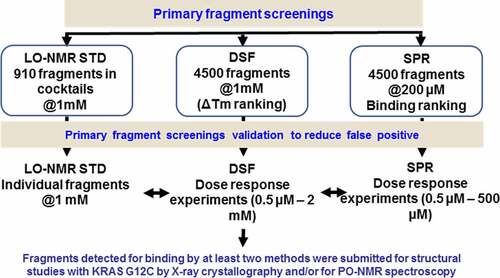
Figure 2. Cpd1 binding mode to KRAS G12C GDP.
a) 2D structure of cpd1b Overall binding mode of cpd1. b) The ligand is in cyan. The protein overall structure is in green with switch I (as defined by [Citation40]) in orange, switch II in pink; the GDP is also depicted (in light orange) to the right of Cys12 (coloured yellow),c) Final 2FoFc-sigmaa weighted map around the ligand, contoured at 1σ,d) Superimposition of the 4EPY ligand (in magenta). .
![Figure 2. Cpd1 binding mode to KRAS G12C GDP.a) 2D structure of cpd1b Overall binding mode of cpd1. b) The ligand is in cyan. The protein overall structure is in green with switch I (as defined by [Citation40]) in orange, switch II in pink; the GDP is also depicted (in light orange) to the right of Cys12 (coloured yellow),c) Final 2FoFc-sigmaa weighted map around the ligand, contoured at 1σ,d) Superimposition of the 4EPY ligand (in magenta). .](/cms/asset/9142f3f7-07d3-46cd-9ad0-65bfb8ae7668/ksgt_a_1979360_f0002_oc.jpg)
Figure 3. Covalent fragment screening flowchart.
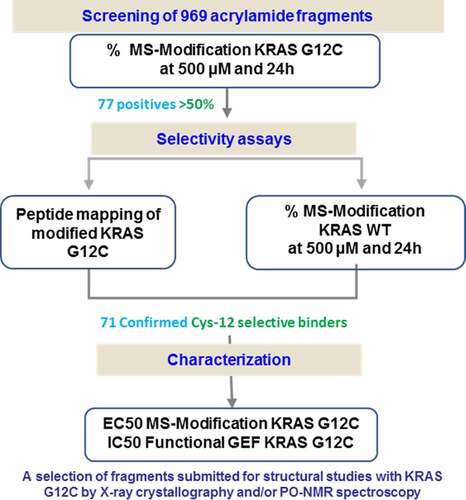
Figure 4. Cpd2 binding mode to KRAS G12C GDP.
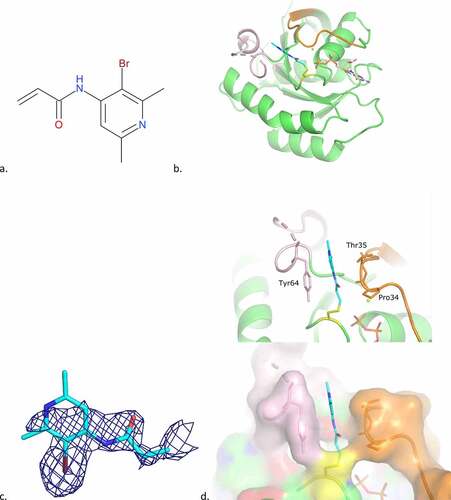
Figure 5. Cpd3 binding mode to KRAS G12C GDP.
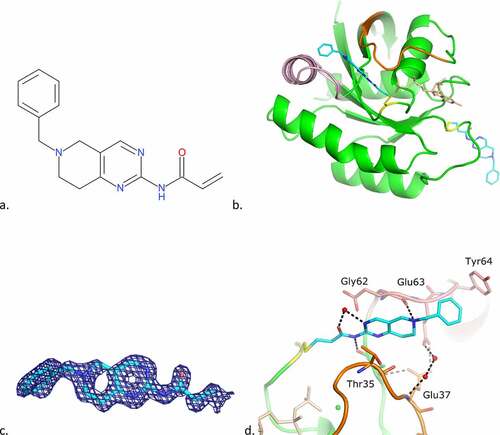
Table 1. Activity of the ligands
Table 2. Crystallographic data
Figure 6. Superimposition of the structure of KRAS G12C GDP in complex with cpd3 and with 4EPY ligand.
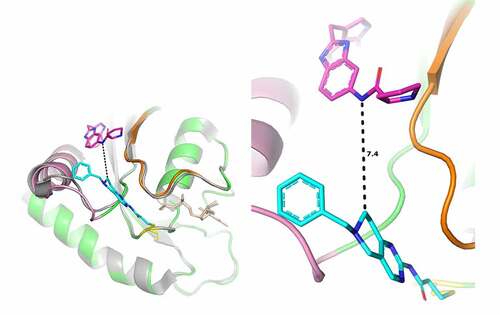
Figure 7. Cpd4 binding mode to KRAS G12C GDP.
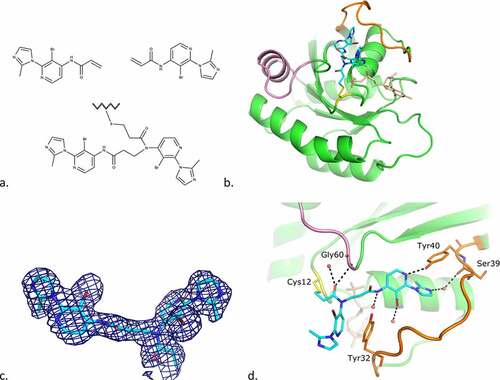
Figure 8. Surface representation of KRAS G12C GDP in complex with cpd4.
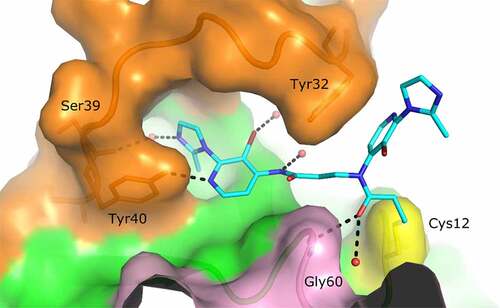
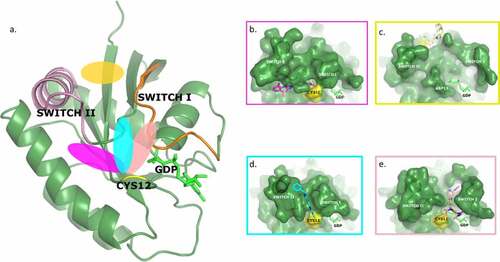
Figure 9. Overall KRAS G12C structure and surface representation of the four binding pockets identified on KRAS. The orientation of the protein is the same in all pictures.