
Figures & data
Table 1. Numbers of GTPases, GEFs and GAPs in group representative dictyostelid genomes
Figure 1. Conservation and change in the Roco GTPase family. While most small GTPases only consist of the GTPase domain, the Roco proteins are unusual in combining a Roc (Ras Of Complex) GTPase domain with a COR (C-terminal of Roc) domain and a plethora of other domains. All GTPases in the Ddis, Dpur, Dlac, Ppal and Dfas genomes were identified from Interpro scans as outlined in Methods, and a pilot phylogenetic tree was prepared from the aligned isolated GTPase sequences. In this tree the Roco GTPases formed a single clade. The sequences in this clade were further supplemented with hits of BLASTp and tBLASTn queries of genomes using Roco sequences as bait. A final tree was then constructed from the Roc sequences by Bayesian inference [Citation26], in which the colour of the gene ID matches that of the species shown in the Dictyostelid phylogeny (lower right). Bayesian posterior probabilities (BIPP) of the nodes are indicated by coloured dots. The tree was annotated with gene names, which were framed in red for genes with known function and with the functional domain architecture of the proteins as analysed in SMART [Citation54]. For overlapping domains, we selected the domain with the lowest E-value. The SMART (full colour) or PFAM (black-shaded rectangle) domain graphics and identifiers are listed in the figure and further domain information can be retrieved from http://smart.embl-heidelberg.de/smart/domain_table.cgi or http://pfam.xfam.org/browse using the identifier as bait. Clades of orthologous proteins and other groupings were further annotated with heatmaps of relative transcript levels at specific developmental stages or in specific cell types, which were retrieved from published RNA sequencing experiments [Citation18,Citation20,Citation21,Citation42] (yellow-red: 0–1 fraction of maximum value), prespore or prestalk cells (white-green: 0–1 fraction of summed reads), or vegetative, spore, stalk and cup cells (white-red: 0–1 fraction of summed reads). Numbers preceded by c. represent hours of starvation in cells set up for encystation. Sets with maximally 10 or less reads are shown in wash-out colour. Note that the phylogeny subdivides the GTPases in clades of conserved orthologs, with orthology further substantiated by similarity of domain architecture. Some Ddis genes such as qkgA-1 and qkgA-2 arose from a very recent duplication of part of chromosome 2. For such genes, transcripts were mapped to only one of the replicates, which is indicated by the last two digits of the locus tags of each gene, separated by /.
![Figure 1. Conservation and change in the Roco GTPase family. While most small GTPases only consist of the GTPase domain, the Roco proteins are unusual in combining a Roc (Ras Of Complex) GTPase domain with a COR (C-terminal of Roc) domain and a plethora of other domains. All GTPases in the Ddis, Dpur, Dlac, Ppal and Dfas genomes were identified from Interpro scans as outlined in Methods, and a pilot phylogenetic tree was prepared from the aligned isolated GTPase sequences. In this tree the Roco GTPases formed a single clade. The sequences in this clade were further supplemented with hits of BLASTp and tBLASTn queries of genomes using Roco sequences as bait. A final tree was then constructed from the Roc sequences by Bayesian inference [Citation26], in which the colour of the gene ID matches that of the species shown in the Dictyostelid phylogeny (lower right). Bayesian posterior probabilities (BIPP) of the nodes are indicated by coloured dots. The tree was annotated with gene names, which were framed in red for genes with known function and with the functional domain architecture of the proteins as analysed in SMART [Citation54]. For overlapping domains, we selected the domain with the lowest E-value. The SMART (full colour) or PFAM (black-shaded rectangle) domain graphics and identifiers are listed in the figure and further domain information can be retrieved from http://smart.embl-heidelberg.de/smart/domain_table.cgi or http://pfam.xfam.org/browse using the identifier as bait. Clades of orthologous proteins and other groupings were further annotated with heatmaps of relative transcript levels at specific developmental stages or in specific cell types, which were retrieved from published RNA sequencing experiments [Citation18,Citation20,Citation21,Citation42] (yellow-red: 0–1 fraction of maximum value), prespore or prestalk cells (white-green: 0–1 fraction of summed reads), or vegetative, spore, stalk and cup cells (white-red: 0–1 fraction of summed reads). Numbers preceded by c. represent hours of starvation in cells set up for encystation. Sets with maximally 10 or less reads are shown in wash-out colour. Note that the phylogeny subdivides the GTPases in clades of conserved orthologs, with orthology further substantiated by similarity of domain architecture. Some Ddis genes such as qkgA-1 and qkgA-2 arose from a very recent duplication of part of chromosome 2. For such genes, transcripts were mapped to only one of the replicates, which is indicated by the last two digits of the locus tags of each gene, separated by /.](/cms/asset/318b883a-057b-43fd-b7d4-5725963e76f3/ksgt_a_1984829_f0001_oc.jpg)
Figure 2. Summary of conservation and change in Dictyostelid GTPases. The presence of orthologous GTPases across the Ddis, Dpur, Dlac, Ppal and Dfas genomes is indicated by green squares in the first 5 columns, which are shown in pale green or with a black border, respectively, when compared to the majority, the functional domains or the developmental regulation are not conserved. Where the number of non-conserved features is larger than 3, pale green or a border is applied to all squares. The colour coding of the 6th, 7th and 8th square in each row respectively represent the developmental expression profile in the majority of species, the prestalk/prespore specificity, when conserved between Ddis and Dpur slugs, the growth, spore or stalk specificity, when conserved between species, and the cup cell specificity in Ddis. The 9th square represents up- or down regulation in encystation of Ppal. Cup cells are only present in group 4 and are bordered red or blue when the orthologs in group 2 or 3 show spore- or stalk-specific expression, respectively. Grey reflects lack of specificity or conflicting data between species or replicate experiments, and white reflects absence of gene or data. The genes are listed by the Ddis gene names or 12 digit Dictybase gene identifiers without the DDB_G0 prefix. Genes with known function in Ddis are bordered in red. The gene identifiers and locus tags for the Dpur, Dlac, Ppal and Dfas genes are listed in Supplemental_Table_S1.xlsx, together with all data on which this figure and are based.
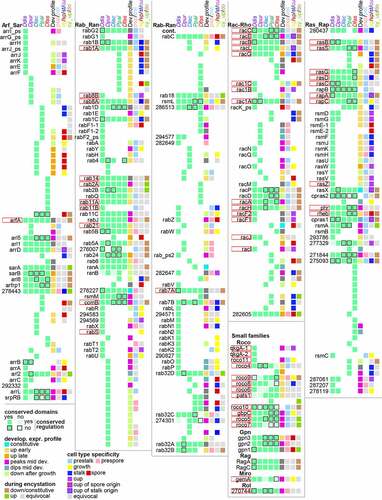
Figure 3. Summary of conservation and change in Dictyostelid GEFs, GAPs and other GTPase regulators. Conservation and change in the presence, functional domain architecture and developmental regulation for sets of orthologous GEFs, GAPs and other regulators are summarized in the first five columns of squares, while the majority developmental profile, cell type specificity and regulation in Ppal encystation are shown in the next four columns. See and its legend for further explanation. The gene identifiers and data upon which the figure is based are listed in Supplemental_Table_S2.xlsx.
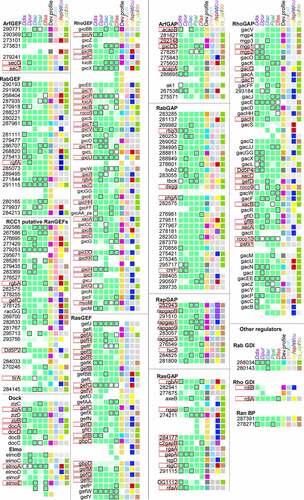
Figure 4. Conservation profiles of GTPases, GEFs and GAPs. For each GTPase, GEF or GAP family and all families of each category combined together, we calculated the percentage of the different states of the following features: A. the total number of orthologs out of five species that were conserved for each gene. B. The host species of genes that were unique. C/D. the phylogenetic distribution of genes with conserved domain and conserved regulation, respectively. The name of each family or grouping and its number of members are shown at the X-axis. The figure is based on the data shown in supplemental figures S1-S16 that are compiled in Supplemental_Table_S1.xlsx and Supplemental_Table_S2.xlsx.
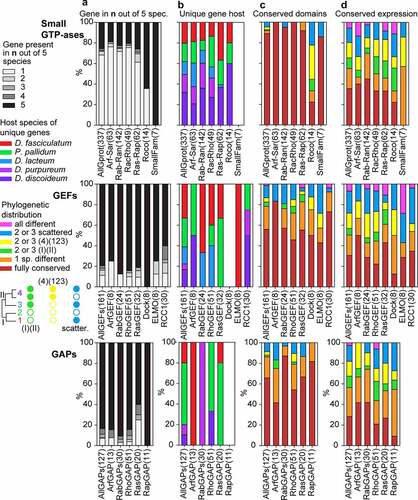
Figure 5. Developmental expression and cell-type specificity of GTPases, GEFs and GAPs. For each GTPase, GEF or GAP family and all families of each category combined together, we calculated the percentage of the different states of the following features: A. The developmental expression profile of the majority of genes within orthologous groups. B. Prestalk or prespore specificity in Ddis and/or Dpur slugs. C. Cell-type specificity in fruiting bodies of the majority of tested species (Ddis, Dlac and Ppal), compared to vegetative cells. C. Expression during encystation in Ppal.
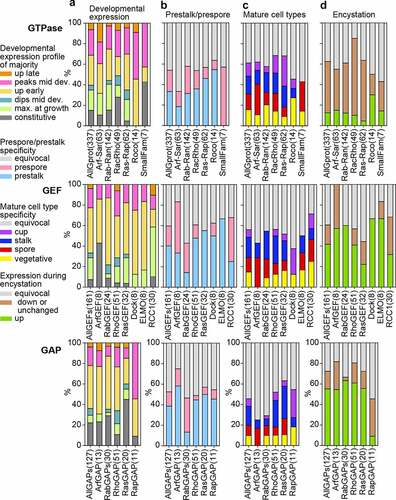
Figure 6. Hierarchical clustering of GTPases, GEFs and GAPs by expression profile. Tree obtained by hierarchical clustering of developmental and cell-type specific gene expression data of GTPases and their direct regulators of the group 4 species Ddis and Dpur, using Pearson correlation to estimate distances between profiles and average linkage to infer the tree. Clusters (C) at a relative branch height of 75% are indicated and heatmaps of all clustered genes are shown. For clusters with >2 known interacting proteins as listed in Supplemental_TableS3.xlsx, sheet 4, the primary interacting partners inside (coloured) and outside (grey) the cluster are visualized as a network using Cytoscape [Citation58]. The complete figure with individual genes annotated with locus tags, interactions, protein function and cellular localization is shown in Supplemental_Fig_S17.pdf and is derived from Supplemental_Table_S4.xlsx, sheet ‘Group4’. A network of all established GTPase and direct regulator interactions is shown in Figure S21.
![Figure 6. Hierarchical clustering of GTPases, GEFs and GAPs by expression profile. Tree obtained by hierarchical clustering of developmental and cell-type specific gene expression data of GTPases and their direct regulators of the group 4 species Ddis and Dpur, using Pearson correlation to estimate distances between profiles and average linkage to infer the tree. Clusters (C) at a relative branch height of 75% are indicated and heatmaps of all clustered genes are shown. For clusters with >2 known interacting proteins as listed in Supplemental_TableS3.xlsx, sheet 4, the primary interacting partners inside (coloured) and outside (grey) the cluster are visualized as a network using Cytoscape [Citation58]. The complete figure with individual genes annotated with locus tags, interactions, protein function and cellular localization is shown in Supplemental_Fig_S17.pdf and is derived from Supplemental_Table_S4.xlsx, sheet ‘Group4’. A network of all established GTPase and direct regulator interactions is shown in Figure S21.](/cms/asset/341ce0fc-edfa-462d-82cc-03218774f7ad/ksgt_a_1984829_f0006_oc.jpg)
Table 2. Expression profiles of conserved and unique GTPases