Figures & data
Figure 1. Fluorescence microscopy reveals Cdc42 spot is within a membrane-bound compartment that segregates with the vacuole. (a) Fluorescence micrograph of 5 minute pulse of 10 µM MDY-64 (green) followed by immediate imaging of cells endogenously expressing Cdc42-mCherrySW (magenta). (b) Montage from a movie of a cell endogenously expressing Cdc42mCherrySW (magenta) and Vph1-GFP (green). (c) Fluorescence micrograph of wildtype cells (top) or vac17∆ cells (bottom) expressing Cdc42-mCherrySW (magenta) and Vph1-GFP (green). (d) Quantification of wildtype or vac17∆ cells containing a Cdc42 spot in the mother cell or bud of budding cells. Wildtype: spots in mother 28.8 ± 1.7% (n = 842); vac17∆: spots in mother 15.3 ± 3.1% (n = 1139) . Time in minutes. All micrographs are maximum intensity projections of 2.5 µm at 0.5 µm steps. All scale bars 5 µm
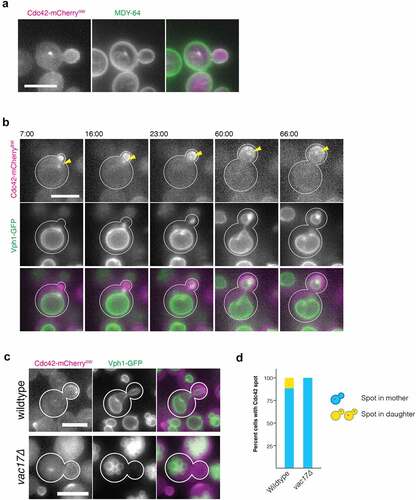
Figure 2. Cdc42 localizes to the NVJ in a cell-cycle dependent manner. (a) Still from a live-cell fluorescence microscopy movie of an unbudded cell (top) and a budded cell (bottom) endogenously expressing Cdc42-mCherrySW and Nvj1-GFP (green). Representative images of unbudded cells displaying overlapping Cdc42 spot and Nvj1 signal (88.5 ± 14.1%, n = 31) and budded cells displaying no overlap of Cdc42 spot and Nvj1 signal (89.4 ± 10.4%, n = 55) (b) Montage of a movie of an unbudded cell endogenously expressing Cdc42-mCherrySW (magenta) and Nvj1-GFP (green). (c) Montage of a movie of a budding cell endogenously expressing Cdc42-mCherrySW (magenta) and Nvj1-GFP (green) with Cdc42 spot in mother. (d) Montage from a movie of a cell endogenously expressing Cdc42-mCherrySW (magenta) and Nvj1-GFP (green) with Cdc42 spot in the bud. Yellow arrow indicates the first frame where the Nvj1-GFP signal is observed. Representative images of cells with bud containing overlapping Cdc42 spot and Nvj1 signal (100 ± 0%, n = 8). All micrographs are maximum intensity projections of 2.5 µm at 0.5 µm steps. All scale bars 5um. All time in minutes
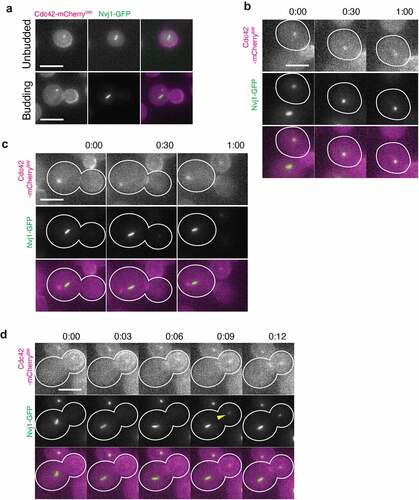
Figure 3. Cdc42 interacts with nucleoporins in vivo and in vitro. (a) Multiple sequence alignment of CRIB motifs from several proteins and a similar sequence in Nup59 (black boxed sequence). Pink shaded letters denote sequence identity. Residues in unshaded pink boxes are similar to conserved residues. (b) GST-pulldown assay using purified GST-fusion proteins as prey proteins immobilized on glutathione agarose and purified soluble His6-Cdc42 as bait. Presence of prey protein was detected by immunoblot against His6 epitope tag. GST-Bem1 serves as a positive control for Cdc42 interaction and GST-Nsp1 serves as an additional negative control to GST alone. (c) Fluorescence micrographs of cells endogenously expressing Cdc42-mCherrySW (magenta) and Nup59-GFP (green). Representative image of cell displaying overlapping Cdc42 spot and Nup59 signal (83.7%, n = 43). (d) Fluorescence micrographs of cells endogenously expressing Cdc42-mCherrySW (magenta) and Nup159-GFP (green, top) or Nup82-GFP (green, bottom). Yellow arrows indicate enrichment of Nups on the nuclear envelope. Representative images of cell displaying overlapping Cdc42 spot and Nup159 signal (80%, n = 30) and overlapping Cdc42 spot and Nup82 signal (71.6 ± 1.6%, n = 55). (e) Fluorescence micrographs of a small budded cell (top) and large-budded cell (bottom) endogenously expressing Cdc42-mCherrySW (magenta) and Nsp1-GFP (green). Yellow arrows indicate cytoplasmic puncta or NE enrichment of Nsp1-GFP. White arrow indicates Nsp1CYT. Representative image of cell displaying overlapping Cdc42 spot and Nsp1 signal (72.8 ± 4.5%, n = 48). (f) Fluorescence micrographs of cells endogenously expressing Cdc42-mCherrySW (magenta) and Nup188-GFP (green) in nup133∆ background. Top cell is unbudded. Bottom cell is budded. All micrographs are maximum intensity projections of 2.5 µm at 0.5 µm steps. All scale bars 5 µm
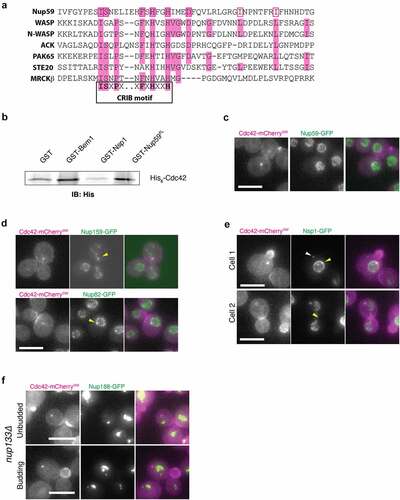
Figure 4. A Cdc42 spot localizes to the distal end of nucleopodia. (a) Montage of a movie of a cell endogenously expressing Cdc42-mCherrySW (magenta) and Ndc1-GFP (green). The contrast was enhanced in the asterisked micrograph to more clearly show the nuclear envelope tether (yellow arrowhead). White arrowheads indicate Ndc1-GFP foci at the spindle pole bodies. Cdc42 spot overlap with Ndc1 signal observed 90.5 ± 6.7%, n = 53 (b) Micrographs of cells endogenously expressing Cdc42-mCherrySW (magenta) and GFP-HDEL (green) at three hours of hydroxyurea treatment (top panels) or after a one-hour release following three-hour hydroxyurea treatment (bottom panels). (c) Micrograph of cell endogenously expressing Cdc42-mCherrySW (magenta) and GFP-HDEL (green) containing Cdc42 spot in the bud proximal to nucleopodium (yellow arrowhead). White arrow indicates Cdc42 spot. Observed 100% of the time, n = 3. (d) Micrograph of cdc23-1 cells endogenously expressing Cdc42-mCherrySW (magenta) and Nsp1-GFP (green) grown at the restrictive temperature of 37°C for three hours (top) or after one-hour of growth at the permissive temperature of 25°C for one hour following three hours of growth at the restrictive temperature of 37°C (bottom). White arrowheads indicate Cdc42 spots. (e) Micrograph of cdc23-1 cells endogenously expressing Cdc42-mCherrySW (magenta) and Nsp1-GFP (green) containing Cdc42 spot in the bud (white arrowhead) grown at the restrictive temperature of 37°C for three hours, then released into the permissive temperature of 25°C for one hour. Yellow arrowhead indicates nucleopodium. All micrographs are maximum intensity projections of 2.5 µm at 0.5 µm steps. All scale bars 5 µm
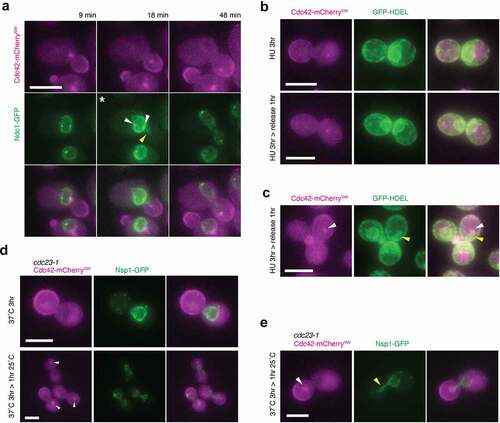
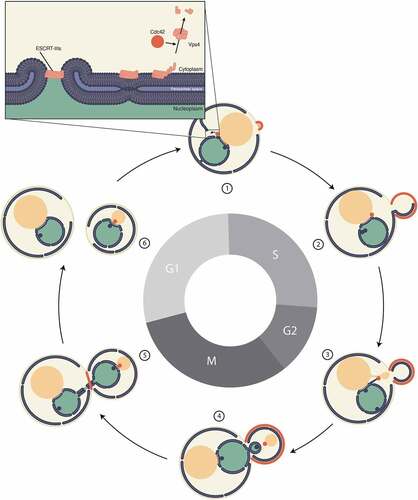
Figure 5. Schematic depicting Cdc42 spot throughout cell cycle progression