671
Views
6
CrossRef citations to date
0
Altmetric
Research Paper

Novel regulation of the transcription factor ZHX2 by N-terminal methylation

, , , ORCID Icon &
Pages 1-15 | Received 23 Feb 2022, Accepted 13 May 2022, Published online: 25 May 2022

Figures & data

Figure 1. Transcripts downregulated in Nrmt1−/− mice. (a) The top ten transcripts with lower expression in Nrmt1−/− mice include Nrmt1 and Mup8. Extending past the top ten into the top 50 reveals downregulation of several other major urinary protein (Mup) transcripts. Gene ontology analysis provided enriched (b) molecular functions and (c) biological processes of the top 50 genes with downregulated expression.
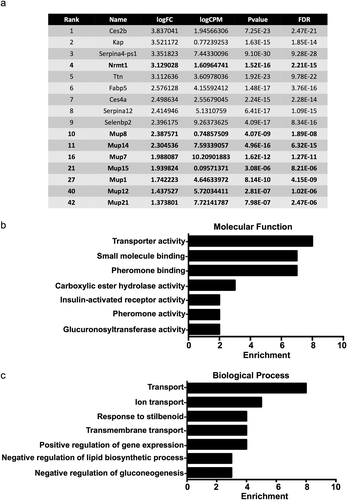
Figure 1. Transcripts downregulated in Nrmt1−/− mice. (a) The top ten transcripts with lower expression in Nrmt1−/− mice include Nrmt1 and Mup8. Extending past the top ten into the top 50 reveals downregulation of several other major urinary protein (Mup) transcripts. Gene ontology analysis provided enriched (b) molecular functions and (c) biological processes of the top 50 genes with downregulated expression.

Figure 2. Transcripts upregulated in Nrmt1−/− mice. (a) The top ten transcripts with higher expression in Nrmt1−/− mice include Cyp2a4 and Cyp4a14. Extending past the top ten into the top 50 reveals upregulation of several other cytochrome P450 (Cyp) transcripts. Gene ontology analysis provided enriched (b) molecular functions and (c) biological processes of the top 50 genes with upregulated expression.
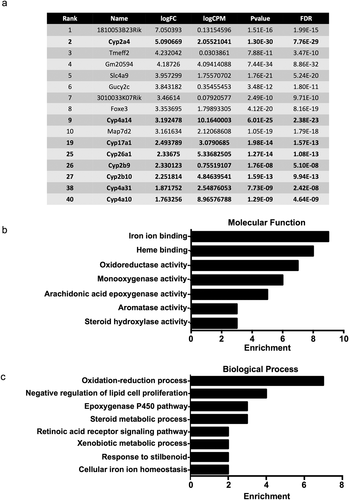
Figure 2. Transcripts upregulated in Nrmt1−/− mice. (a) The top ten transcripts with higher expression in Nrmt1−/− mice include Cyp2a4 and Cyp4a14. Extending past the top ten into the top 50 reveals upregulation of several other cytochrome P450 (Cyp) transcripts. Gene ontology analysis provided enriched (b) molecular functions and (c) biological processes of the top 50 genes with upregulated expression.

Figure 3. qRT-PCR verification of RNA sequencing. (a-c) qRT-PCR analysis of wild-type (WT) and Nrmt1 knockout (Nrmt1−/−) mice shows (a) decreased Nrmt1 expression, (b) decreased Mup1 and Mup7 expression, and (c) increased Cyp17a1 and Cyp2a4 expression in Nrmt1−/− mice. * denotes p < 0.05 and ** denotes p < 0.01 as determined by unpaired t-test. n = 3. Error bars represent ± standard error of the mean (SEM).
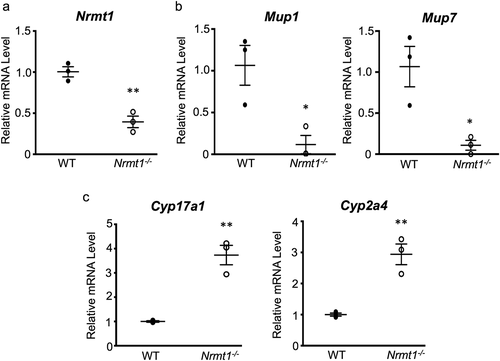
Figure 3. qRT-PCR verification of RNA sequencing. (a-c) qRT-PCR analysis of wild-type (WT) and Nrmt1 knockout (Nrmt1−/−) mice shows (a) decreased Nrmt1 expression, (b) decreased Mup1 and Mup7 expression, and (c) increased Cyp17a1 and Cyp2a4 expression in Nrmt1−/− mice. * denotes p < 0.05 and ** denotes p < 0.01 as determined by unpaired t-test. n = 3. Error bars represent ± standard error of the mean (SEM).
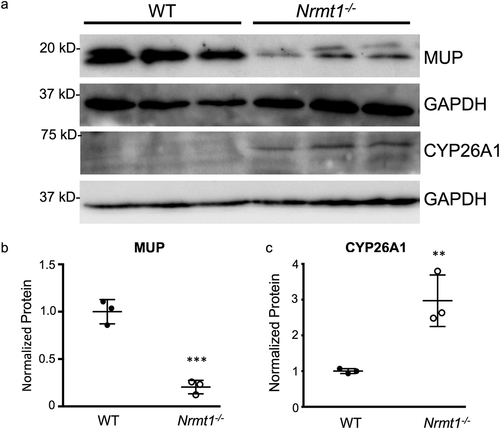
Figure 4. Western blot verification of RNA sequencing. (a) Western blot analysis of wild-type (WT) and Nrmt1 knockout (Nrmt1−/−) mouse livers verifies (b) significant downregulation of MUP protein levels in Nrmt1−/− mice and (c) significant upregulation of CYP26A1 protein levels in Nrmt1−/− mice. GAPDH is used as a loading control. ** denotes p < 0.01 and *** denotes p < 0.001 as determined by unpaired t-test. n = 3. Error bars represent ± standard error of the mean (SEM).
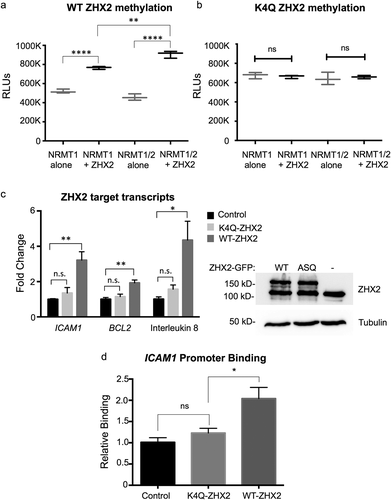
Figure 4. Western blot verification of RNA sequencing. (a) Western blot analysis of wild-type (WT) and Nrmt1 knockout (Nrmt1−/−) mouse livers verifies (b) significant downregulation of MUP protein levels in Nrmt1−/− mice and (c) significant upregulation of CYP26A1 protein levels in Nrmt1−/− mice. GAPDH is used as a loading control. ** denotes p < 0.01 and *** denotes p < 0.001 as determined by unpaired t-test. n = 3. Error bars represent ± standard error of the mean (SEM).

Figure 5. ZHX2 is methylated by NRMT1 and Nα-methylation regulates ZHX2 function. In vitro methyltransferase assays show (a) ZHX2 peptide is methylated by recombinant NRMT1 but (b) K4Q ZHX2 peptide is not. Addition of NRMT2 also significantly increases the methylation activity of NRMT1 for WT ZHX2 but has no effect on K4Q ZHX2 methylation. (c – left) qRT-PCR analysis of the ZHX2 target transcripts ICAM1, BCL2, and interleukin 8 in untransfected, K4Q-ZHX2-GFP overexpressing, or WT-ZHX2-GFP overexpressing 786-O cells shows a significant increase in expression of all three genes when comparing WT overexpression to untransfected. K4Q overexpression does not significantly alter transcript expression as compared to untransfected. (c – right) Western blot confirms equal expression of WT and K4Q-ZHX2-GFP. Tubulin is used as a loading control. (d) Chromatin immunoprecipitation showing the K4Q mutation reduces ZHX2 occupancy of the ICAM1 promoter to that seen in the untransfected control. * denotes p < 0.05, ** denotes p < 0.01, and **** denotes p < 0.0001 as determined by unpaired t-test. n = 3. Error bars represent ± standard error of the mean (SEM).

Figure 5. ZHX2 is methylated by NRMT1 and Nα-methylation regulates ZHX2 function. In vitro methyltransferase assays show (a) ZHX2 peptide is methylated by recombinant NRMT1 but (b) K4Q ZHX2 peptide is not. Addition of NRMT2 also significantly increases the methylation activity of NRMT1 for WT ZHX2 but has no effect on K4Q ZHX2 methylation. (c – left) qRT-PCR analysis of the ZHX2 target transcripts ICAM1, BCL2, and interleukin 8 in untransfected, K4Q-ZHX2-GFP overexpressing, or WT-ZHX2-GFP overexpressing 786-O cells shows a significant increase in expression of all three genes when comparing WT overexpression to untransfected. K4Q overexpression does not significantly alter transcript expression as compared to untransfected. (c – right) Western blot confirms equal expression of WT and K4Q-ZHX2-GFP. Tubulin is used as a loading control. (d) Chromatin immunoprecipitation showing the K4Q mutation reduces ZHX2 occupancy of the ICAM1 promoter to that seen in the untransfected control. * denotes p < 0.05, ** denotes p < 0.01, and **** denotes p < 0.0001 as determined by unpaired t-test. n = 3. Error bars represent ± standard error of the mean (SEM).

Figure 6. Postnatal Gpc3 and H19 expression is de-repressed in Nrmt1−/− livers. qRT-PCR analysis of wild-type (WT) and Nrmt1 knockout (Nrmt1−/−) mouse livers reveals (a) Afp expression is not de-repressed in Nrmt1−/− livers between 0 and 21 days after birth. However, (b) Gpc3 and (c) H19 expression is significantly de-repressed by 21 days. ** denotes p < 0.01 as determined by unpaired t-test. n = 3. Error bars represent ± standard error of the mean (SEM).

Figure 6. Postnatal Gpc3 and H19 expression is de-repressed in Nrmt1−/− livers. qRT-PCR analysis of wild-type (WT) and Nrmt1 knockout (Nrmt1−/−) mouse livers reveals (a) Afp expression is not de-repressed in Nrmt1−/− livers between 0 and 21 days after birth. However, (b) Gpc3 and (c) H19 expression is significantly de-repressed by 21 days. ** denotes p < 0.01 as determined by unpaired t-test. n = 3. Error bars represent ± standard error of the mean (SEM).
Supplemental material

Supplemental Material

Download Zip (2.4 MB)

Reprints and Corporate Permissions

Please note: Selecting permissions does not provide access to the full text of the article, please see our help page How do I view content?

To request a reprint or corporate permissions for this article, please click on the relevant link below:

Academic Permissions

Please note: Selecting permissions does not provide access to the full text of the article, please see our help page How do I view content?

Obtain permissions instantly via Rightslink by clicking on the button below:

If you are unable to obtain permissions via Rightslink, please complete and submit this Permissions form. For more information, please visit our Permissions help page.