Figures & data
Figure 1. Polymerase chain reaction (PCR) amplification of rDNA by internal transcribed spacer (ITS) universal primers and polyketide synthase gene by the LC1–LC2c set of degenerate primers from Phomopsis liquidambaris CBR-18. Lanes: M = 100 bp DNA ladder; ITS = ITS1 and ITS4 universal primers; LC = LC1 and LC2c degenerate primers.
Figure 2. Internal transcribed spacer (ITS) sequence-based neighbour joining tree of Phomopsis sp. isolates: consensus neighbour joining dendrogram with bootstrap values (1000 replications) based on multiple sequence alignment. The scale bar indicates nucleotide substitutions per nucleotide position.
Figure 3. Antimicrobial activity of ethyl acetate extract of Phomopsis liquidambaris CBR-18 against (a) Escherichia coli, (b) Staphylococcus aureus, (c) Salmonella typhi, and (d) Bacillus subtilis by disc diffusion assay. +ve = positive control; –ve = ethyl acetate as negative control.
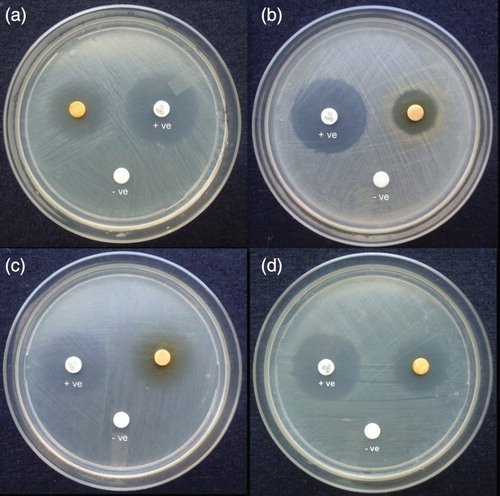
Table 1. Antimicrobial activity of ethyl acetate extract of Phomopsis liquidambaris CBR-18 (100 µg/disc) isolated from Cryptolepis buchanani Roem.
Figure 4. (a) Thin-layer chromatogram of column purified fractions showing an active band at an Rf value of 0.56. (b) Chromatogram of purified compound using preparative thin-layer chromatography (TLC). (c) TLC–bioautography assay of purified compound showing a zone of inhibition against Staphylococcus aureus.
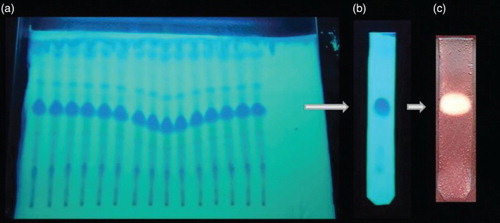
Figure 5. Electrospray ionization time-of-flight mass spectrometry (ESI-TOF-MS) of oblongolide Y showing a major molecular ion peak at 301.1607 [M+Na]+.
![Figure 5. Electrospray ionization time-of-flight mass spectrometry (ESI-TOF-MS) of oblongolide Y showing a major molecular ion peak at 301.1607 [M+Na]+.](/cms/asset/d3ef5efa-6318-4692-8dee-845202ecf6e6/tfls_a_1033768_f0005_c.jpg)
Figure 6. Structure of oblongolide Y.