Figures & data
Figure 1. Location of eleven Prunus padus populations in South Korea for this study.
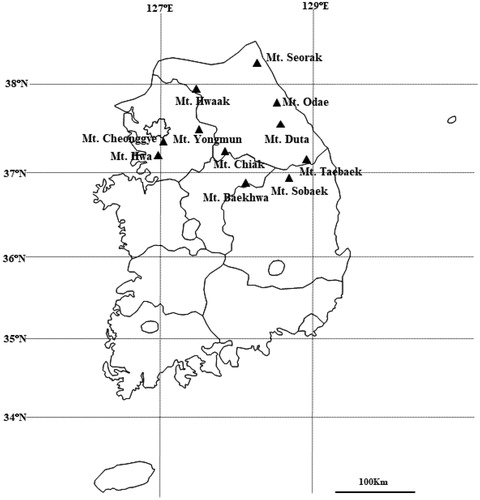
Table 1. Number of AFLP amplified bands and polymorphic bands per primer-restriction enzyme combinations from Prunus padus populations.
Table 2. Genetic diversity parameters estimated from Prunus padus populations.
Table 3. Distribution of genetic variations of Prunus padus populations from analysis of molecular variance (AMOVA).
Table 4. Inbreeding coefficient (f) and population differentiation (θII) of Prunus padus using different models based on Bayesian method.
Figure 2. UPGMA dendrogram based on Nei's genetic distance of each Pruns padus population.
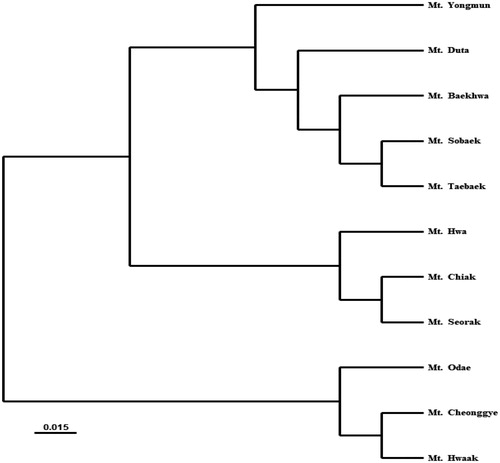
Figure 3. Principal components analysis (PCA) for Prunus padus populations. Axis 1 and axis 2 were explained 38.22 and 20.28% of genetic variation, respectively.
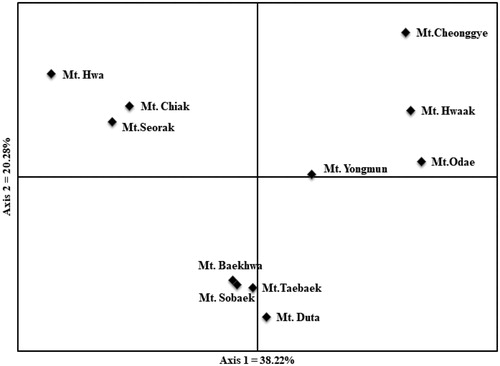
Figure 4. Results of Bayesian clustering analysis. (A) The mean log-likelihood value (±standard deviation) of the data was ten repetitions for each K value. (B) The value of delta K (ΔK) was changed as each K value. (C) Assignment probabilities at the individual and population levels estimated using Bayesian clustering. Each individual is shown as a vertical line divided into segments representing the estimated membership proportion.
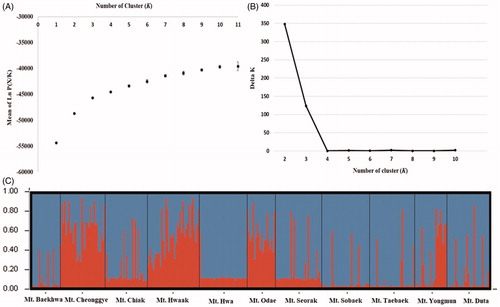
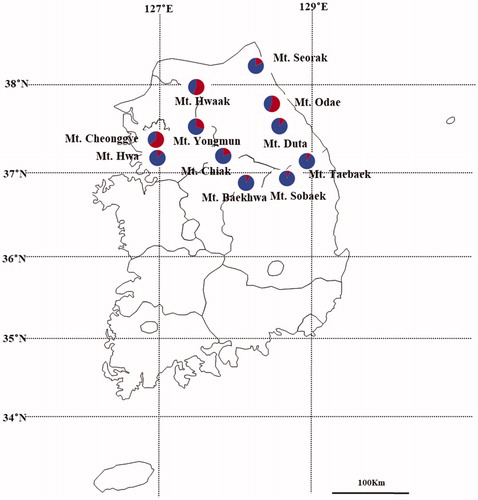
Figure 5. Geographic distribution pattern of two clusters estimated by using Bayesian clustering.