Figures & data
Figure 1. The daily change of soil moisture of seedlings in different drought stress periods.
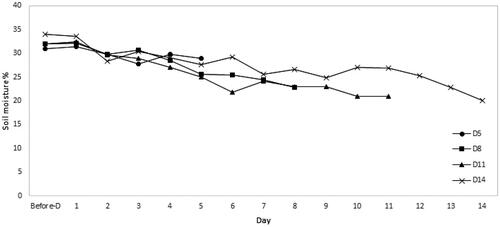
Table 1. Summary of treatment and growth condition of D. cochinchinensis seedlings.
Table 2. Mean different and standard deviation of minimum fluoresence (Fo), maximum fluoresence (Fm) and maximal PS II photochemical efficiency (Fv/Fm) before and after different drought stress period compared by paired t-test.
Table 3. Mean different and standard deviation of Chlorophyll content of seedlings before and after different drought stress period compared by paired t-test.
Table 4. Mean different and standard deviation of Transpiration rate (E), Stomatal conductance (gs), Net photosynthetic rate (A) and Water use efficiency (WUE) before and after different drought stress period compared by paired t-test.
Table 5. Mean different and standard deviation of leaf temperature of seedlings before and after drought stress at different period compared by paired t-test.
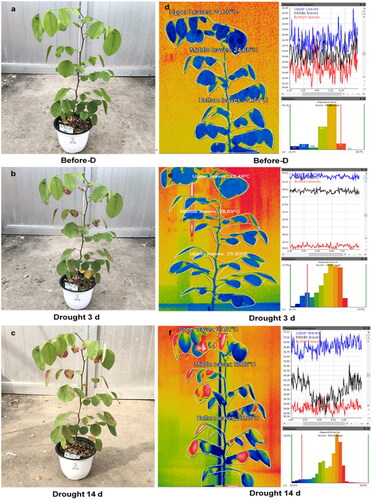
Figure 2. Visual and thermal image of D. cochinchinensis seedlings over the drought period 14 days. (a), (b) (c) visual image and (d), (e), (f) Thermal image at day before drought, drought at day 3 and drought at day 14.