
Figures & data
Figure 1. Map of the study area showing the location of Qadis district, in Badghis province, Afghanistan.
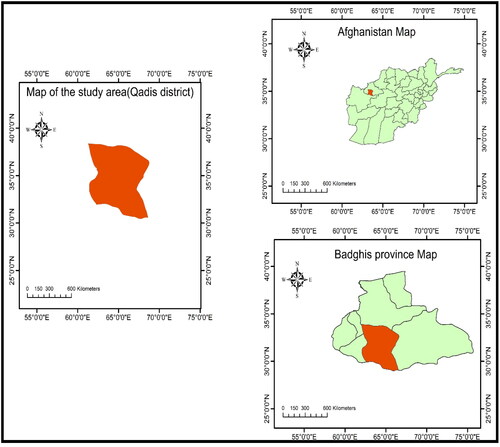
Figure 2. Diagram showing the experimental process in white poplar forest in Qadis district
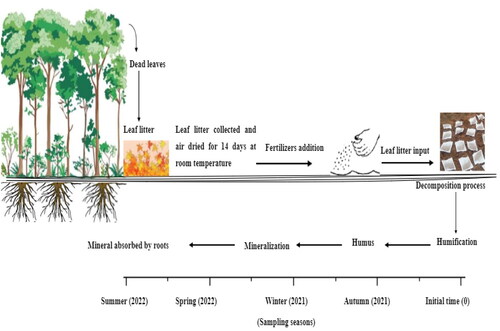
Figure 3. Effect of various fertilizers on leaf litter decompositions at different sampling times. Values are Mean ± SE.
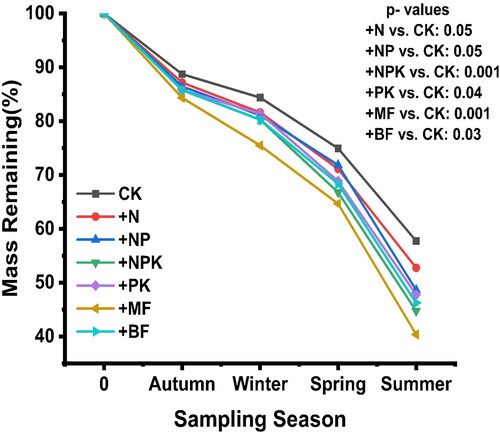
Table 1. Leaf litter decomposition constant, correlation coefficient, at T50% and T95% decomposition of White poplar leaf litter under various fertilizers. All relationship was significant (***p < 0.001)
Figure 4. The dynamic of Carbon, Nitrogen, Phosphorus, and Potassium concentration in leaf litter for treatments during the decomposition process at four sampling times (means ± SE), p < 0.05.
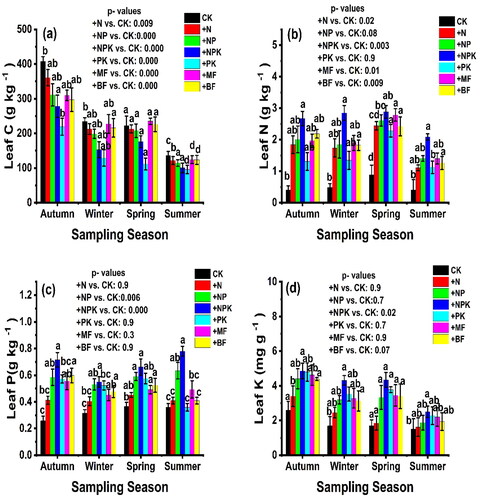
Figure 5. Dynamic characteristics of soil (SOC, TN, TP, and TK) for treatments during the decomposition process at four sampling times (means ± SE), p < 0.05.
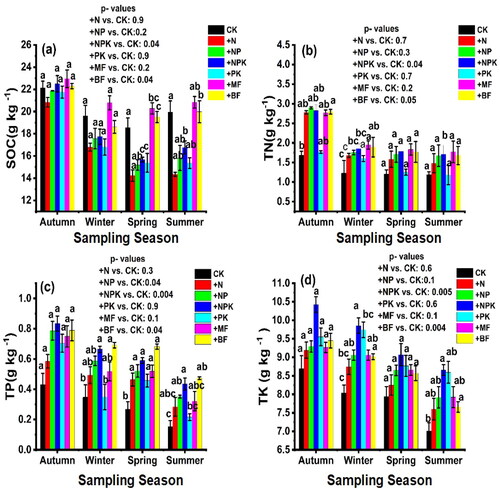
Table 2. Comparison of physicochemical characteristics of soil in different fertilizer treatments at white poplar forest at four sampling times. Different lower- case letters within columns indicate significant difference among means.
Figure 6. Stoichiometric characteristics of C, N, P, and K in leaf litter and soil for treatments during the decomposition process at four sampling times (means ± SE), p < 0.05, p < 0.01, p < 0.001.
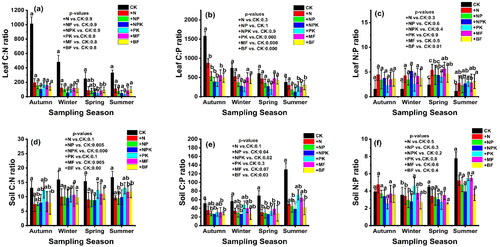
Figure 7. Correlations between C, N, P and K concentration in leaf litter and soil at four sampling stages (means ± SE), p < 0.05, p < 0.01, p < 0.001.
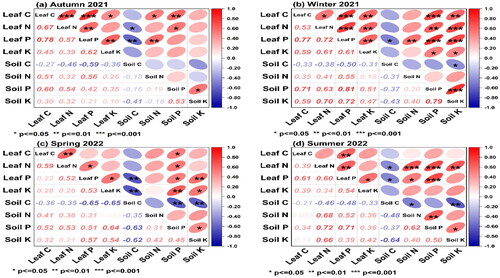
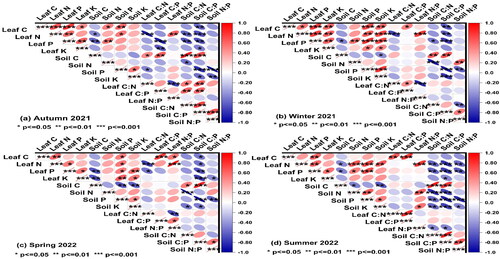
Figure 8. Correlations between C, N, P and K concentration and between their stoichiometric characters at four sampling stages (means ± SE), p < 0.05, p < 0.01, p < 0.001.
Data Availability
Data will be available on request.