1,388
Views
37
CrossRef citations to date
0
Altmetric
Research Paper

Small-sized granules of biphasic bone substitutes support fast implant bed vascularization

, , , , , , & show all
Article: e1056943 | Received 02 Mar 2015, Accepted 26 May 2015, Published online: 01 Sep 2015

Figures & data

Figure 1. shows SEM pictures of the analyzed bone substitute granules. A1–3 show the properties of BoneCeramic (BC) with granule sizes between 500–1000 μm, while B1–3 show the characteristics of BoneCeramic (BC) with granule sizes between 400–700 μm. Note the differences in granule sizes between BoneCeramic 500–1000 µm and 400–700 µm (A1 and B1), while no differences were observable in the other physical properties, such as granule shape (A2 and B2), surface texture and pore distribution (A3 and B3) (A1 and B1: 25x magnification, scale bar = 1 mm; A2 and B2: 200x magnification, scale bar = 200 µm; A3 and B3: 1000x magnification, scale bar = 20 µm).
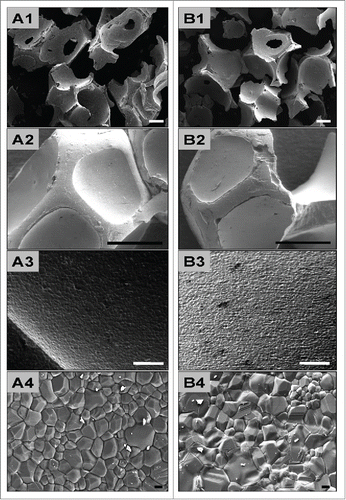
Figure 1. shows SEM pictures of the analyzed bone substitute granules. A1–3 show the properties of BoneCeramic (BC) with granule sizes between 500–1000 μm, while B1–3 show the characteristics of BoneCeramic (BC) with granule sizes between 400–700 μm. Note the differences in granule sizes between BoneCeramic 500–1000 µm and 400–700 µm (A1 and B1), while no differences were observable in the other physical properties, such as granule shape (A2 and B2), surface texture and pore distribution (A3 and B3) (A1 and B1: 25x magnification, scale bar = 1 mm; A2 and B2: 200x magnification, scale bar = 200 µm; A3 and B3: 1000x magnification, scale bar = 20 µm).

Figure 2. shows the tissue reactions as well as the vascularization pattern of the 2 analyzed bone substitute granule types, BoneCeramic 500–1000 μm and BoneCeramic 400–700 μm. A1 and B1: On day 3, a surface layer composed of fibrin and connective tissue fibers (blue arrows) was observed on the surface of both materials, while the granules (BC) were embedded within an fiber-rich and loose connective tissue (CT) (H&E-staining, 400x magnification, scale bars = 10 µm). A2 – A3 and B2 – B3: On days 10 and 15, the interspaces of both bone substitute granules (BM) were filled up by a cell- and vessel-rich (red arrows) connective tissue (CT). At the surfaces of both granule sizes mainly mononuclear cells (black arrows) were detectable beside low numbers of multinucleated giant cells (arrow heads) (A2 and B2: Movat Pentachrome-stainings; A3 and B3: Azan-stainings; 400x magnification, scale bars = 10 µm). A4 – A5 and B4 – B5: On days 30 and 60 both granule sizes of the bone substitute (BC) were still surrounded by a cell- and vessel-rich (red arrows) connective tissue (CT). Also primarily mononuclear cells (black arrows) were found at the surfaces of both materials, while increased numbers of multinucleated giant cells (arrow heads) were found in the implantation beds of BoneCeramic 400–700 μm (B4 and B5) compared with those of BoneCeramic 500–1000 μm (A4 – A5) (A4 and B4: Azan-staining; A3 and B3: Movat Pentachrome-staning; 400x magnification, scale bars = 10 µm).
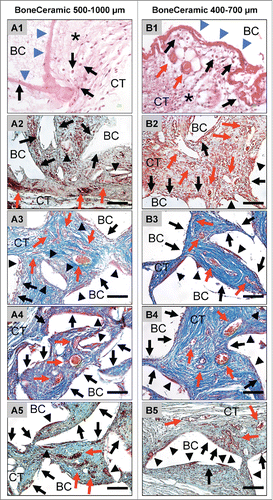
Figure 2. shows the tissue reactions as well as the vascularization pattern of the 2 analyzed bone substitute granule types, BoneCeramic 500–1000 μm and BoneCeramic 400–700 μm. A1 and B1: On day 3, a surface layer composed of fibrin and connective tissue fibers (blue arrows) was observed on the surface of both materials, while the granules (BC) were embedded within an fiber-rich and loose connective tissue (CT) (H&E-staining, 400x magnification, scale bars = 10 µm). A2 – A3 and B2 – B3: On days 10 and 15, the interspaces of both bone substitute granules (BM) were filled up by a cell- and vessel-rich (red arrows) connective tissue (CT). At the surfaces of both granule sizes mainly mononuclear cells (black arrows) were detectable beside low numbers of multinucleated giant cells (arrow heads) (A2 and B2: Movat Pentachrome-stainings; A3 and B3: Azan-stainings; 400x magnification, scale bars = 10 µm). A4 – A5 and B4 – B5: On days 30 and 60 both granule sizes of the bone substitute (BC) were still surrounded by a cell- and vessel-rich (red arrows) connective tissue (CT). Also primarily mononuclear cells (black arrows) were found at the surfaces of both materials, while increased numbers of multinucleated giant cells (arrow heads) were found in the implantation beds of BoneCeramic 400–700 μm (B4 and B5) compared with those of BoneCeramic 500–1000 μm (A4 – A5) (A4 and B4: Azan-staining; A3 and B3: Movat Pentachrome-staning; 400x magnification, scale bars = 10 µm).

Figure 3. shows exemplary pictures of the TRAP-activity of the material-associated multinucleated giant cells adjacent to the bone substitute granules of BoneCeramic 500–1000 μm (A1 – A4) and BoneCeramic 400–700 μm (B1 – B4) on days 10 (A1 and B1), 15 (A2 and B2), 30 (A3 and B3) and 60 (A4 and B4) after implantation (TRAP-staining, 200x magnification, scale bars = 100 µm).
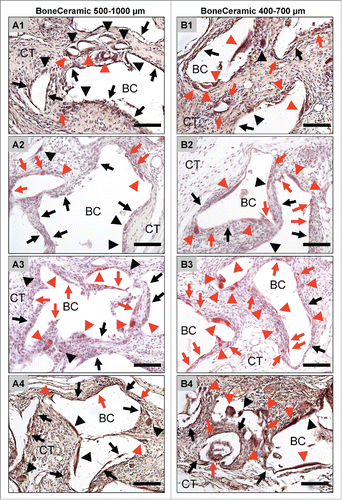
Figure 3. shows exemplary pictures of the TRAP-activity of the material-associated multinucleated giant cells adjacent to the bone substitute granules of BoneCeramic 500–1000 μm (A1 – A4) and BoneCeramic 400–700 μm (B1 – B4) on days 10 (A1 and B1), 15 (A2 and B2), 30 (A3 and B3) and 60 (A4 and B4) after implantation (TRAP-staining, 200x magnification, scale bars = 100 µm).

Figure 4. shows the results of the histomorphometrical vascularization analysis of the implantation beds of the 2 bone substitute granule types compared with the control group. (A) Vessel density; (B) percent vascularization (*/**/*** = inter-individual statistical significances, •/••/••• = intra-individual statistical significances).
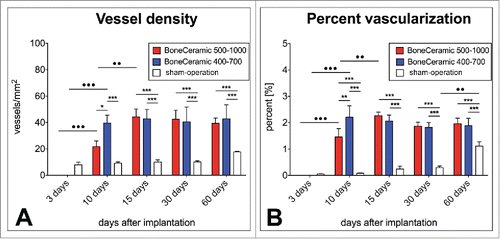
Figure 4. shows the results of the histomorphometrical vascularization analysis of the implantation beds of the 2 bone substitute granule types compared with the control group. (A) Vessel density; (B) percent vascularization (*/**/*** = inter-individual statistical significances, •/••/••• = intra-individual statistical significances).
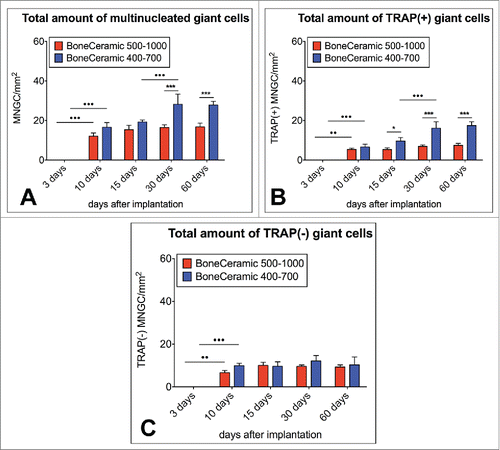
Figure 5. shows the results of the histomorphometrical giant cell analysis within the implantation beds of the 2 bone substitute typess considering the different cellular activity conditions, including the total number of material-related multinucleated giant cells (A) as well as the TRAP-positive (B) and the TRAP-negative multinucleated giant cells (C) (*/**/*** = inter-individual statistical significances, •/••/••• = intra-individual statistical significances).

Figure 5. shows the results of the histomorphometrical giant cell analysis within the implantation beds of the 2 bone substitute typess considering the different cellular activity conditions, including the total number of material-related multinucleated giant cells (A) as well as the TRAP-positive (B) and the TRAP-negative multinucleated giant cells (C) (*/**/*** = inter-individual statistical significances, •/••/••• = intra-individual statistical significances).

Figure 6. shows TEM images of the mononuclear cells involved in the tissue reactions to the BoneCeramic 400–700 µm (BC) bone substitute on day 15 after implantation. (A) Shows an overview of the implantation bed of BoneCeramic 400–700 µm granules (BC) within the subcutaneous connective tissue (CT) of the CD-1 mouse. At the surfaces of the granules, primarily mononuclear cells (black arrows) were detectable (690x magnification, scale bar = 10 µm). (B) Shows a material-related mononuclear cell that has vacuoles containing phagocytosed bone substitute material fragments (blue arrows). These vacuoles were regularly found within the cytoplasm of the cell in the direct vicinity of cisterns of the rough endoplasmic reticulum (yellow arrow head) as well as vacuoles with electron-dense contents (green arrow head) (N = nucleus) (1900x magnification, scale bar = 6 µm). (C) Shows the cytoplasm of the material-adherent phagocytosing mononuclear cell at a higher magnification. Vacuoles containing phagocytosed material fragments (blue dashed line) were regularly observed within the direct vicinity of cisterns of the rough endoplasmic reticulum (yellow arrow head) as well as other cell organelles that seemed to be involved in the process of active phagocytosis, such as mitochondria (blue arrow head) (N= nucleus). Interestingly, a vesicle (white arrow head) seemed to fuse with the vesicle containing the material fragment (13000x magnification, scale bar = 500 nm).
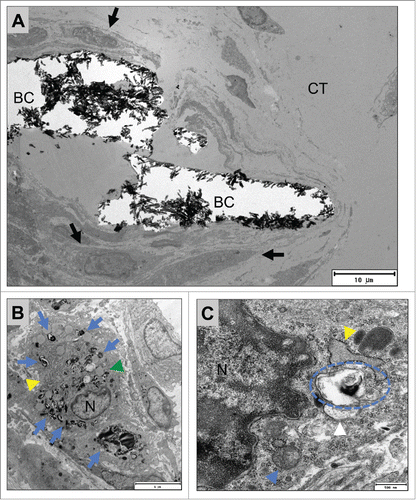
Figure 6. shows TEM images of the mononuclear cells involved in the tissue reactions to the BoneCeramic 400–700 µm (BC) bone substitute on day 15 after implantation. (A) Shows an overview of the implantation bed of BoneCeramic 400–700 µm granules (BC) within the subcutaneous connective tissue (CT) of the CD-1 mouse. At the surfaces of the granules, primarily mononuclear cells (black arrows) were detectable (690x magnification, scale bar = 10 µm). (B) Shows a material-related mononuclear cell that has vacuoles containing phagocytosed bone substitute material fragments (blue arrows). These vacuoles were regularly found within the cytoplasm of the cell in the direct vicinity of cisterns of the rough endoplasmic reticulum (yellow arrow head) as well as vacuoles with electron-dense contents (green arrow head) (N = nucleus) (1900x magnification, scale bar = 6 µm). (C) Shows the cytoplasm of the material-adherent phagocytosing mononuclear cell at a higher magnification. Vacuoles containing phagocytosed material fragments (blue dashed line) were regularly observed within the direct vicinity of cisterns of the rough endoplasmic reticulum (yellow arrow head) as well as other cell organelles that seemed to be involved in the process of active phagocytosis, such as mitochondria (blue arrow head) (N= nucleus). Interestingly, a vesicle (white arrow head) seemed to fuse with the vesicle containing the material fragment (13000x magnification, scale bar = 500 nm).

Figure 7. shows TEM pictures of the multinucleated giant cells adherent to the surfaces of BoneCeramic 500–1000 µm granules (BC) within the subcutaneous connective tissue (CT) of the CD-1 mouse on day 15 after implantation. (A) shows an overview of a material-adherent multinucleated giant cell (MNGC, black arrow heads) at the surface of the BoneCeramic 500–1000 µm (BC) that has invaginated material fragments (blue arrows) (1200x magnification, scale bar = 9 µm). (B) and (C) show a multinucleated giant cell (black arrow heads) adherent to a BC 500–1000 granule surface (BC). Within their cytoplasm (CP) mitochondria (blue arrow heads), many cisterns of the rough endoplasmic reticulum (rER, red arrow head) and different vesicles (green arrow heads) were found. Furthermore, a zone demarcated by the material surface and the cell membrane of the giant cell (red asterisks) was found that did not contain cell organelles but rather electron-dense content (B) 4800x magnification, scale bar = 2 µm; (C): 9300x magnification, scale bar = 1 µm). (D) Shows the adherent podosome-like cell branch (read dashed line) of the multinucleated giant cell (C = cytoplasm) at the surface of the bone substitute granule (BC) that seems to separate the demarcation zone (red asterisk) from the surrounding connective tissue (CT). Furthermore, a bundle of intracellular intermediate filaments were found near the cell branch (orange arrow heads) (23000x magnification, scale bar = 200 nm).
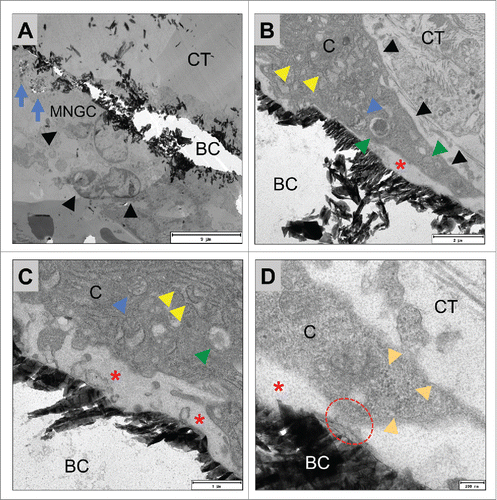
Figure 7. shows TEM pictures of the multinucleated giant cells adherent to the surfaces of BoneCeramic 500–1000 µm granules (BC) within the subcutaneous connective tissue (CT) of the CD-1 mouse on day 15 after implantation. (A) shows an overview of a material-adherent multinucleated giant cell (MNGC, black arrow heads) at the surface of the BoneCeramic 500–1000 µm (BC) that has invaginated material fragments (blue arrows) (1200x magnification, scale bar = 9 µm). (B) and (C) show a multinucleated giant cell (black arrow heads) adherent to a BC 500–1000 granule surface (BC). Within their cytoplasm (CP) mitochondria (blue arrow heads), many cisterns of the rough endoplasmic reticulum (rER, red arrow head) and different vesicles (green arrow heads) were found. Furthermore, a zone demarcated by the material surface and the cell membrane of the giant cell (red asterisks) was found that did not contain cell organelles but rather electron-dense content (B) 4800x magnification, scale bar = 2 µm; (C): 9300x magnification, scale bar = 1 µm). (D) Shows the adherent podosome-like cell branch (read dashed line) of the multinucleated giant cell (C = cytoplasm) at the surface of the bone substitute granule (BC) that seems to separate the demarcation zone (red asterisk) from the surrounding connective tissue (CT). Furthermore, a bundle of intracellular intermediate filaments were found near the cell branch (orange arrow heads) (23000x magnification, scale bar = 200 nm).

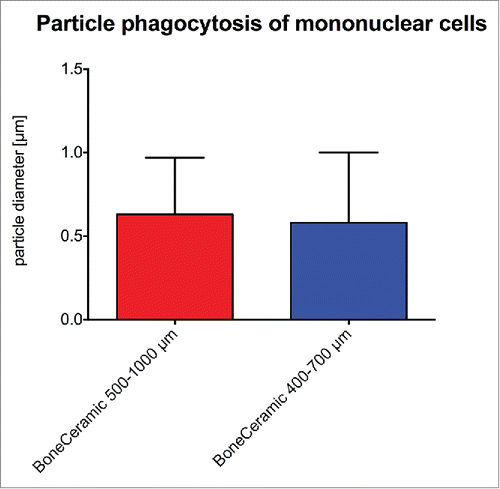
Figure 8. shows the results of the histomorphometrical measurements of the particle sizes phagocytosed by mononuclear cells in the cases of both granule sizes of the bone substitute material.

Figure 8. shows the results of the histomorphometrical measurements of the particle sizes phagocytosed by mononuclear cells in the cases of both granule sizes of the bone substitute material.