
Figures & data
Table 1. Profiles of registered participants obtained from the pre-event standard questionnaire
Table 2. Comparison of post-course standard evaluation ratings (on a 1 to 5 Likert scale) of face-to-face upper extremity course in 2019 and online offerings in 2020 (in grey the 8 consecutive weeks course)
Figure 1. Pre- and post-course motivation to learn (difference between present and desired level of ability on a 1 to 5 Likert scale) per competency (C) and pre- and post-course knowledge test (multiple-choice questions MCQs)
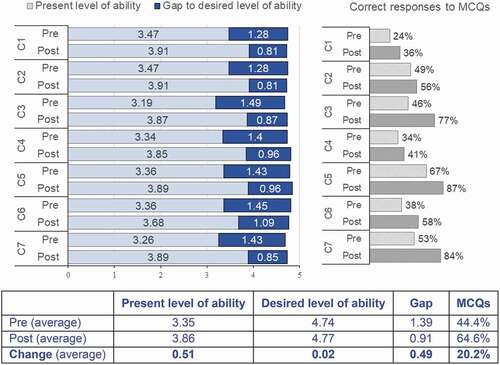
Table 3. Content (cases) and online experience ratings on a 1 to 5 Likert scale for the 8 modules (by subgroup)
Table 4. Combined results of the post-course questionnaire. N = 56 participants (62% completion rate) and n = 31 faculty (91% completion rate)
Table 5. Subcategories of statements about what went well and about what we could do differently next time